



Robinhood Markets Inc (HOOD) reported second-quarter results on July 29 that beat on nearly every line yet left the market focused on one forward metric. Revenue reached $1.31 billion, up from $989 million a year earlier and ahead of the roughly $1.28 billion consensus, while diluted EPS of $0.62 beat the $0.42 estimate by close to 50%. Shares slipped 2% to 3% in the sessions around the print, easing back after a roughly 40% rebound from the company's Q1 miss.
The results were not the problem. Revenue grew 33%, the earnings beat was driven by strong trading volumes across equities, options, crypto and event contracts alongside lower operating expenses, and management pointed to increased diversification of the business. What tempered the reaction was the forward look. Analysts flagged soft net-deposit trends in July, which when extrapolated pointed to roughly $12 billion of net deposits in the third quarter against $19 billion in the year-ago period, raising a question about the pace of new money entering the platform.
The HOOD stock forecast for 2026 now centers on two competing views:
- The super-app case: Bulls expect event contracts, tokenized stocks, the Robinhood Chain, Robinhood Ventures and continued operating leverage from a June headcount reduction to sustain growth, with analyst targets running as high as $160.
- The deposit-slowdown case: Bears see decelerating net deposits, dependence on volatile trading volumes, and a stock trading around 45 times forward earnings that leaves limited room if retail activity cools.
This guide breaks down the HOOD stock forecast, 2026 price scenarios, key risks, and research from Needham, KeyBanc, Barclays, JPMorgan and BTIG, drawing on the July 29 earnings release and the Q2 investor call, plus how to trade HOOD stock futures on BingX TradFi with USDT collateral.
Top 5 Things for HOOD Investors to Know in July 2026
- Q2 EPS of $0.62 beat by nearly 50%: Diluted EPS topped the $0.42 consensus by roughly 48%, driven by strong trading activity and lower operating expenses, a sharp reversal from the Q1 miss.
- Revenue of $1.31 billion grew 33%: Revenue beat the roughly $1.28 billion Street estimate and rose from $989 million a year earlier, with growth across equities, options, crypto and event contracts.
- Operating leverage drove the beat: Analysts attributed much of the upside to lower operating expenses following a June headcount reduction of roughly 10%, and management lowered its full-year operating expense guide on AI efficiency gains.
- July net-deposit trends softened: Extrapolated July data pointed to roughly $12 billion of Q3 net deposits against $19 billion a year earlier, the metric investors were most likely to fixate on.
- Analyst targets span a wide range: Price targets run from a low near $65 to a Street high of $160, with an average around $125, as several firms trimmed targets after the print while maintaining Buy or Overweight ratings.
What Is Robinhood Markets Inc (HOOD)?

Robinhood Markets Inc is a financial services company headquartered in Menlo Park, California, that provides retail brokerage, cryptocurrency trading, investment advisory, digital banking and private markets access. It targets a new generation of investors with a mobile-first platform and a market capitalization of roughly $100 billion.
The business has diversified well beyond commission-free equity trading. Transaction-based revenue spans equities, options and crypto, while newer lines include event contracts, tokenized stocks, digital banking and advisory products. Under CEO Vlad Tenev, Robinhood has pursued a strategy of becoming a financial super app, adding products such as the Robinhood Chain, Robinhood Ventures and Trump Accounts, with a stated goal of broadening ownership. Recent quarters have shown increasing diversification, with options and equities trading growing alongside a rebound in crypto activity, and the company has used a June headcount reduction and AI efficiency gains to improve operating leverage. Regulatory catalysts such as progress on the CLARITY Act have supported sentiment across crypto-linked financial platforms.
Robinhood (HOOD) Q2 2026 Earnings: What Drove the Beat and the Deposit Concern
- Trading volumes stayed strong across asset classes. Equities, options, crypto and event contracts all contributed, lifting revenue 33% and providing the base for the earnings beat.
- Operating expenses came in lower. A June headcount reduction of roughly 10% and AI efficiency gains reduced costs, which analysts identified as the primary driver of the EPS beat.
- Business diversification increased. The revenue mix broadened across trading and newer product lines, reducing dependence on any single activity and supporting the super-app thesis.
- Net-deposit momentum slowed in July. Extrapolated July figures suggested a step down in net deposits versus the prior year, the main reason the beat did not translate into a stronger share-price reaction.
- Full-year expense guidance was lowered. Management cut its full-year operating expense guide, signaling that the operating leverage that boosted the quarter should continue into the second half.
Robinhood Q2 2026 Financial and Consensus Profile: Revenue, EPS and Margins
Robinhood's Q2 print showed a company beating on revenue and earnings while the market focused on a single forward metric. The gap between a near 50% EPS beat and a modestly negative share-price reaction is the central fact of the quarter.
|
Financial Metric |
Consensus Estimate |
Reported / Actual |
Surprise |
|
Q2 2026 Revenue |
~$1.28 billion |
$1.31 billion |
Beat; up 32% year over year |
|
Q2 2026 Diluted EPS |
~$0.42 |
$0.62 |
Beat by roughly 48% |
|
Q2 2026 EPS (year-ago) |
— |
$0.42 |
Prior-year comparison |
|
Q2 2026 Revenue (year-ago) |
— |
$989 million |
Prior-year comparison |
|
Q3 2026 Net Deposits (implied) |
~$19 billion prior year |
~$12 billion extrapolated |
Softer July trend |
|
FY2026 Operating Expense Guide |
— |
Lowered |
AI efficiency gains and June layoffs |
|
FY2026 EPS (consensus) |
— |
~$1.81 |
Down 11.7% from $2.05 in 2025 |
|
FY2027 EPS (consensus) |
— |
~$2.49 |
Projected rebound of 37.6% |
For context, Robinhood shares had fallen 13.2% after the Q1 2026 miss, when the company generated $0.38 EPS and $1.07 billion in revenue amid weaker take rates and softer crypto revenue. The Q2 rebound reversed that narrative, though full-year 2026 EPS is still expected to decline before a projected rebound in 2027. The stock has historically shown large post-earnings moves, with an average absolute swing near 9% over the prior four quarters.
Robinhood (HOOD) 2026 Investment Outlook: $160 Bull Case vs. $65 Bear Case
Robinhood's outlook for the rest of 2026 depends on one central question: whether the platform's growing product breadth can sustain revenue as trading volumes fluctuate, or whether slowing net deposits signal a cooling in retail engagement.
The Bull Case: Event Contracts and the Robinhood Chain Push HOOD Toward $160
The bull case rests on diversification and operating leverage. Revenue grew 33% with contributions across equities, options, crypto and event contracts, and the June headcount reduction plus AI efficiency gains lifted margins, driving the near 50% EPS beat. That combination suggests Robinhood can grow earnings even in quarters where any single trading line softens.
This scenario requires the newer products to keep scaling. Event contracts have shown solid growth, tokenized stocks and the Robinhood Chain expand the addressable market, and regulatory progress on the CLARITY Act supports sentiment for crypto-linked platforms. Needham's pre-earnings target reached $123 and the Street high sits at $160, reflecting confidence that Robinhood is leading the race to become a financial super app. Continued volume strength and higher take rates would strengthen the path toward those levels.
The Base Case: Robinhood Consolidates Between $85 and $125
In the base case, Robinhood sustains its diversified revenue while net deposits normalize rather than accelerate. Trading volumes stay healthy across asset classes, operating leverage continues into the second half as guided, and the stock trades around its average target near $125 while investors watch deposit trends.
The lower expense base provides support while the valuation stays elevated. With full-year 2026 EPS expected to decline before a projected 2027 rebound, steady execution could keep HOOD in the mid $80s to mid $120s as the market weighs strong volumes against softer deposit momentum. The wide analyst dispersion defines the range.
The Bear Case: Slowing Deposits Pull HOOD Toward $65
The bear case requires the deposit slowdown to signal broader retail cooling. Extrapolated July data pointed to roughly $12 billion of Q3 net deposits against $19 billion a year earlier, and Robinhood's revenue remains sensitive to volatile trading volumes.
A second quarter of decelerating deposits combined with softer crypto and options activity would be the clearest trigger. HOOD trades around 45 times forward earnings, and the Q1 2026 miss showed how quickly weaker take rates can pressure results. If retail engagement fades while the valuation stays full, the stock could retest support near $89 before moving toward the low end of the target range near $65.
HOOD Stock Price Forecasts for 2026 By Wall Street Analysts
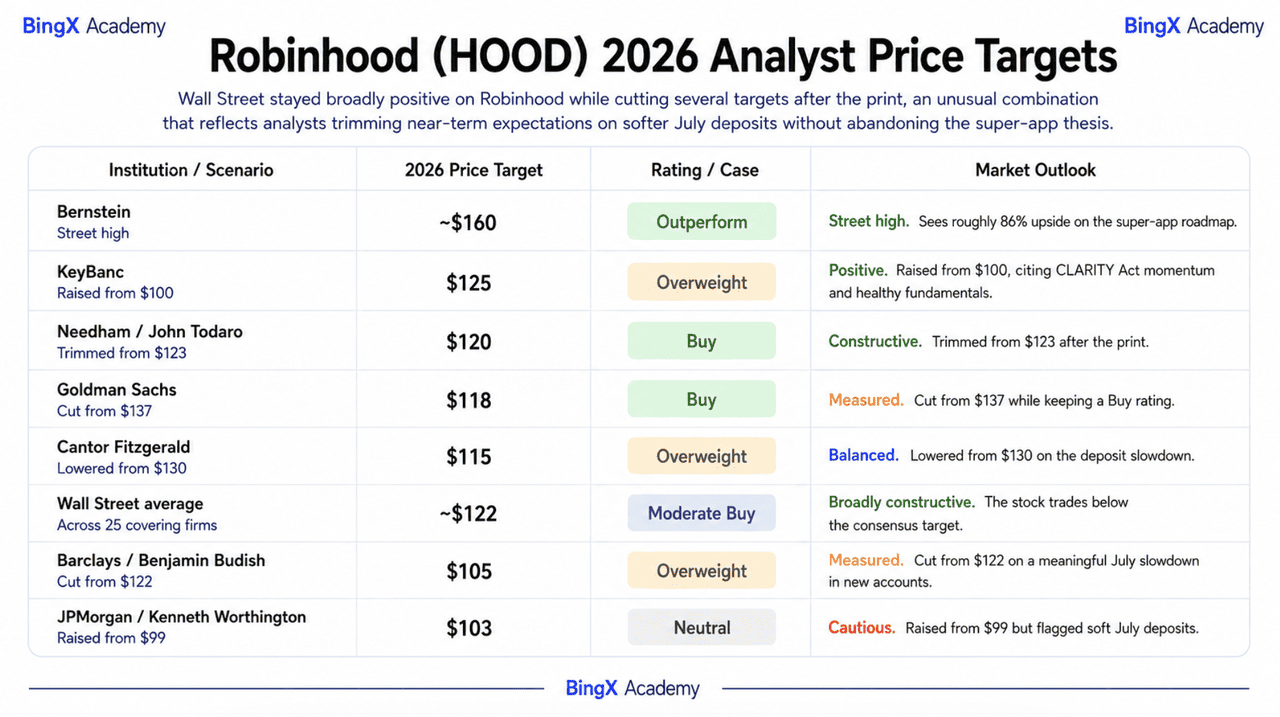
Wall Street stayed broadly positive on Robinhood while cutting several targets after the print, an unusual combination that reflects analysts trimming near-term expectations on softer July deposits without abandoning the super-app thesis. Ratings run roughly 18 Buy across 25 covering firms, with a wide dispersion from the low $100s to a Street high near $160.
|
Institution |
2026 Price Target |
Rating |
Market Outlook |
|
Bernstein |
~$160 |
Outperform |
Street high. Sees roughly 86% upside on the super-app roadmap. |
|
KeyBanc |
$125 |
Overweight |
Positive. Raised from $100, citing CLARITY Act momentum and healthy fundamentals. |
|
Needham / John Todaro |
$120 |
Buy |
Constructive. Trimmed from $123 after the print. |
|
Goldman Sachs |
$118 |
Buy |
Measured. Cut from $137 while keeping a Buy rating. |
|
Cantor Fitzgerald |
$115 |
Overweight |
Balanced. Lowered from $130 on the deposit slowdown. |
|
Wall Street average |
~$122 |
Moderate Buy |
Broadly constructive; the stock trades below the consensus target. |
|
Barclays / Benjamin Budish |
$105 |
Overweight |
Measured. Cut from $122 on a meaningful July slowdown in new accounts. |
|
JPMorgan / Kenneth Worthington |
$103 |
Neutral |
Cautious. Raised from $99 but flagged soft July deposits. |
How to Trade Robinhood Markets Inc (HOOD) Stock on BingX
Navigate the volatility of Robinhood's earnings cycle using BingX TradFi and BingX AI tools. By leveraging AI-driven predictive analytics, you can better anticipate market sentiment shifts and price action around quarterly releases. BingX offers two routes to HOOD exposure: tokenized stock for direct spot ownership, and perpetual futures for leveraged long or short positions.
Spot Trading: Buy and Own HOOD Tokenized Stocks Directly
Spot trading is the most straightforward way to gain Robinhood exposure on BingX. When users buy tokenized HOOD on the spot market, they hold the asset directly in their BingX spot account, with no leverage, no funding costs and no liquidation risk.
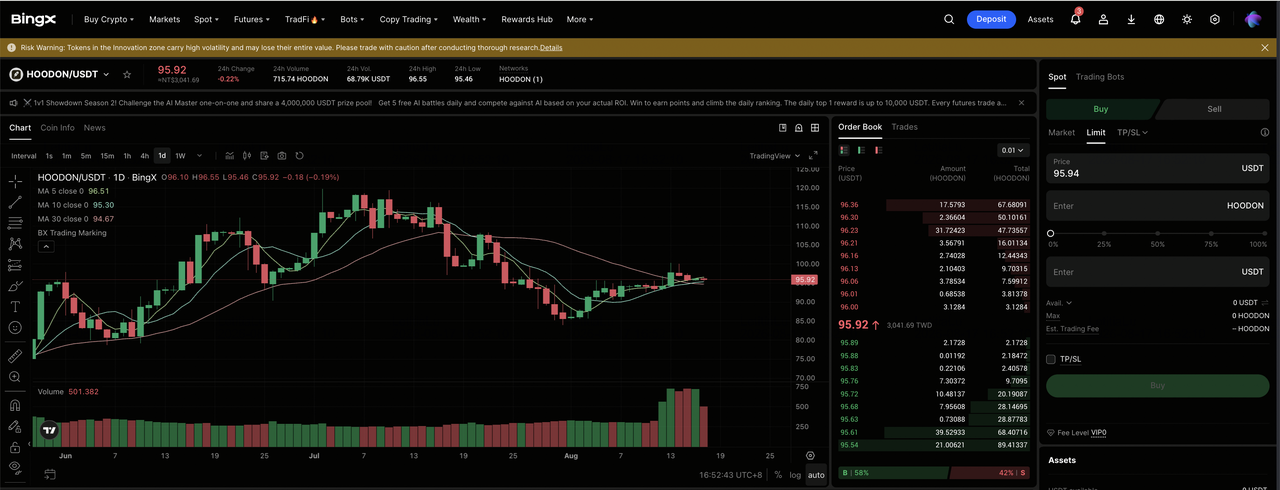
Step 1: Account setup and security. Sign up and log into your BingX account, complete the identity verification (KYC) required in your region, and enable two-factor authentication.
Step 2: Fund your spot account. Deposit USDT or another supported asset into your BingX spot account. Where available, users can also use supported fiat on-ramp options.
Step 3: Navigate to the spot market. Search for the HOODON/USDT trading pair.
Step 4: Place your order. Choose a market order to buy tokenized HOOD immediately at the current price, or use a limit order to set the price you want to pay. Because Robinhood slipped after the print on soft July deposit trends despite a near 50% EPS beat, a limit order lets you define your entry rather than chase a post-earnings move.
Step 5: Manage your position. Once filled, your tokenized HOOD appears in your spot account, where it tracks the underlying share price. Spot positions carry no liquidation risk, which makes them suitable for holding through an earnings release.
Futures Trading: Long or Short HOOD on BingX TradFi
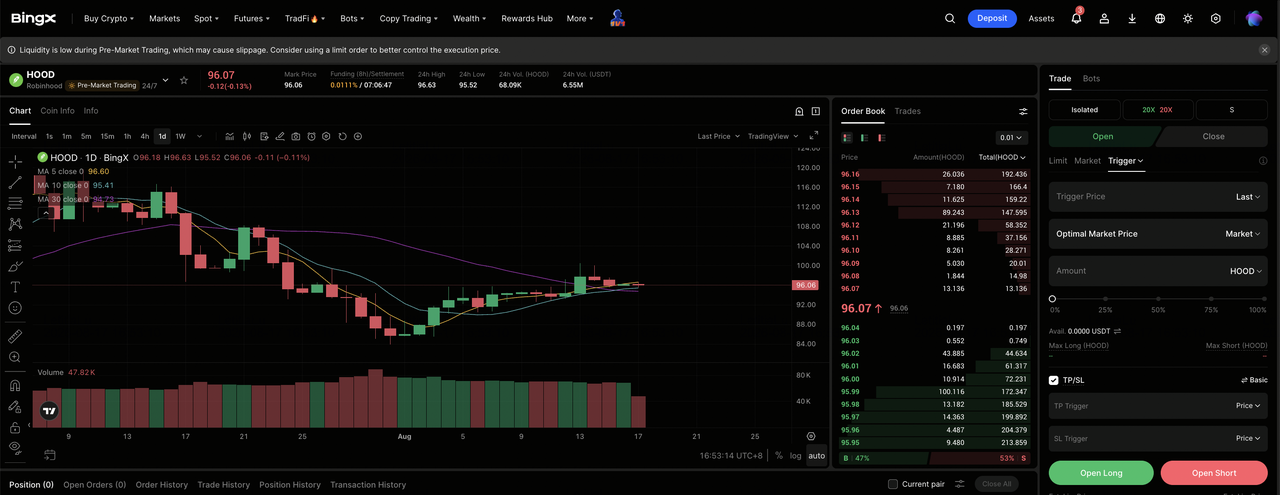
Step 1: Access BingX TradFi. Sign up and navigate to the specialized TradFi section on the main BingX exchange dashboard.
Step 2: Select Robinhood Markets Inc (HOOD). Search for and select the HOOD-USDT perpetual futures contract.
Step 3: Choose your direction. Select Open Long if you expect event contracts and tokenized stocks to keep scaling, operating leverage to continue, and net deposits to stabilize. Select Open Short if you expect deposit momentum to keep slowing, trading volumes to soften, or the market to reprice a 45 times forward multiple.
Step 4: Select leverage and margin mode. Choose Isolated or Cross-Margin based on your risk tolerance. Because HOOD has shown average post-earnings moves near 9% and options markets priced a roughly 11% move around Q2, conservative leverage and clear position sizing are important.
Step 5: Execute strict risk protocols. Set Take-Profit and Stop-Loss (TP/SL) levels before or immediately after entering the trade. HOOD can react quickly to quarterly earnings, monthly volume and deposit disclosures, crypto market activity, regulatory developments such as the CLARITY Act, and new product launches.
Top 5 Risks to Watch for HOOD Investors in 2026
To navigate the second half of 2026, investors must weigh Robinhood's product breadth and operating leverage against these five structural and macro headwinds.
- Net deposits are slowing: Extrapolated July trends pointed to roughly $12 billion of Q3 net deposits against $19 billion a year earlier, a signal that new money entering the platform may be cooling.
- Revenue depends on volatile trading volumes: Transaction-based revenue across equities, options and crypto can swing sharply with market activity, as the Q1 2026 miss demonstrated.
- The valuation leaves limited room: HOOD trades around 45 times forward earnings, so any disappointment in volumes or deposits could pressure the stock quickly.
- Crypto exposure adds cyclicality: Crypto revenue declined 38% year over year to $100 million in Q2 2026, and the segment remains sensitive to digital-asset price cycles.
- Full-year earnings are set to decline before rebounding: Consensus expects 2026 EPS to fall roughly 12% before a projected 2027 recovery, leaving the near-term trajectory dependent on execution.
Final Thoughts: Should You Invest in Robinhood in 2026?
Robinhood after the July 29 report is a story of a diversifying platform beating expectations while the market watches its deposit engine. A $1.31 billion quarter up 32%, a near 50% EPS beat, broadening revenue across trading and newer products, and improving operating leverage are not in dispute. What is in dispute is whether slowing net deposits are a temporary pause or the start of cooling retail engagement.
The bull case is that event contracts, tokenized stocks, the Robinhood Chain and continued cost discipline make Robinhood the leader in becoming a financial super app. The bear case is that revenue still depends on volatile trading volumes, deposits are decelerating, and around 45 times forward earnings the stock reflects much of the growth thesis. Investors confident in the product roadmap may view any pullback as an entry point. More conservative traders might wait for deposit trends to stabilize, using support near $89 and the average target near $125 as the levels that define the range.
Risk Reminder: Trading and investing in equities like HOOD involves a high risk of capital loss. Robinhood is exposed to trading-volume cycles, crypto market volatility, regulatory change, and a valuation sensitive to shifts in retail engagement. Conduct independent research before allocating capital.
Related Reading
- Coinbase (COIN) Stock Forecast for 2026: Can the Everything Exchange Take COIN Back to $300?
- SOFI Stock Outlook 2026: Can SOFI Cross $30 on Growing Next-Gen Banking and Blockchain Infra?
- Reddit (RDDT) Price Outlook for 2026: Can AI Data Licensing Drive RDDT Back to $200?
- Mastercard (MA) Stock Price Forecast for 2026: Fintech Giant or Regulatory Target?
- Figma (FIG) Price Prediction 2026: $36.00 AI Launchpad or Overvalued Post-IPO Hangover Trap?
