

QuantumScape (QS) develops solid-state lithium-metal battery technology for electric vehicles and other energy-storage markets. Its design replaces the conventional graphite or silicon anode with an anode-free architecture and uses a proprietary ceramic separator intended to support higher energy density, faster charging and improved safety. That technical ambition gives QuantumScape exposure to a large battery transition, but leaves the stock sensitive to manufacturing yield, qualification timing and the cost of moving from pilot output to commercial scale.
The latest quarter showed measurable commercial engagement without removing the scale-up risk. QuantumScape Q2 2026 GAAP net loss narrowed to $98.2 million from $114.7 million a year earlier, adjusted EBITDA loss was $64.2 million and customer billings reached $10.8 million. First-half billings of $21.8 million already exceeded the $19.5 million recorded in all of 2025, while $859.0 million of liquidity supported a multiyear development runway.
The QS stock forecast for 2026 now centers on two competing views:
- The industrialization and partner-validation case: Eagle Line output, Cobra separator production and work with PowerCo, Honda, Murata and Corning demonstrate that the technology can advance from automotive samples toward repeatable high-volume manufacturing.
- The yield and commercialization-timing case: Cell qualification takes longer than expected, capital needs rise and meaningful royalty or product revenue remains too distant to offset continuing annual adjusted EBITDA losses of $250 million to $275 million.
This guide breaks down the QS stock forecast, 2026 price scenarios, key risks and analyst outlooks, drawing on QuantumScape's July 22, 2026 Q2 earnings release, quarterly filing and market data through September 24, plus how to trade QS stock futures on BingX TradFi with USDT collateral.
Top 5 Things for QuantumScape Investors to Know in September 2026
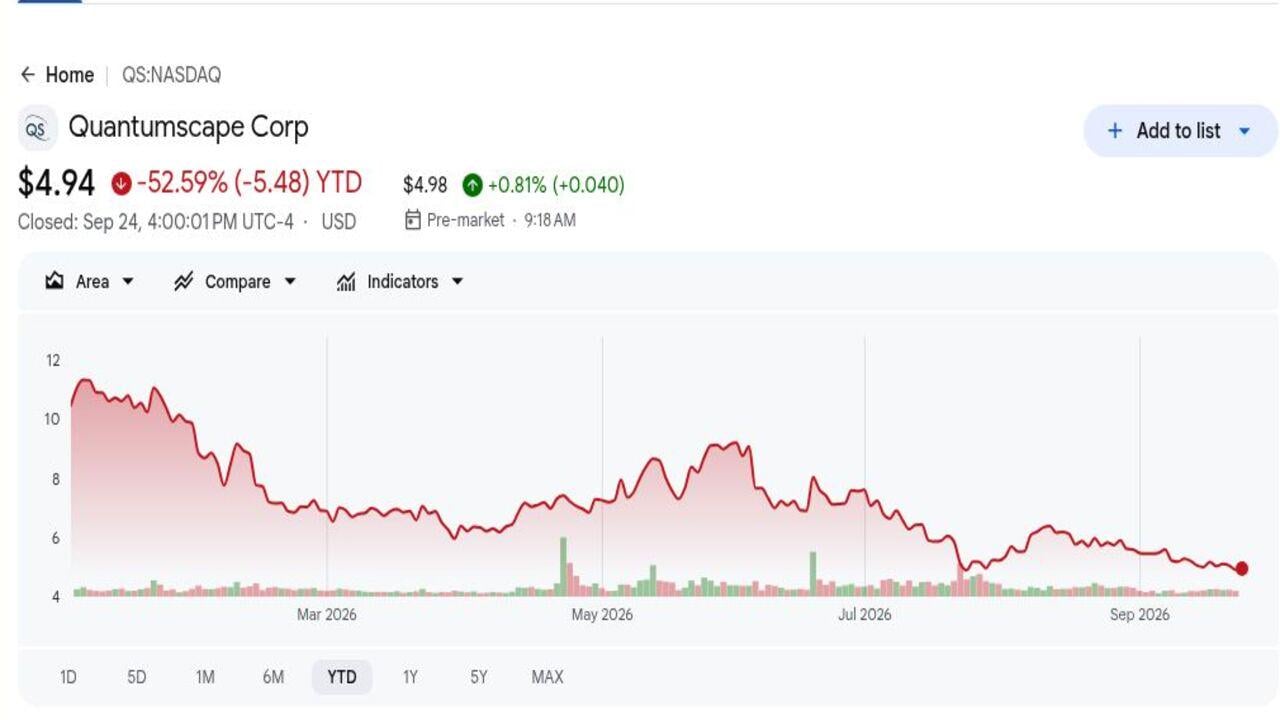
- QS closed at $4.94 and was down 52.59% in 2026: Shares finished near the $4.76 52-week low after trading as high as $19.07. The decline shows investors have shifted focus from technical milestones toward commercial production and customer qualification.
- Q2 GAAP net loss narrowed by $16.5 million to $98.2 million: Operating expenses fell 14.2% to $106.1 million, though QuantumScape remains pre-revenue under GAAP. Management still expects a full-year adjusted EBITDA loss of $250 million to $275 million.
- First-half customer billings reached $21.8 million: The total already exceeded the $19.5 million generated during all of 2025. Billings are not GAAP revenue, but they show customers are funding development work as programs move through technical milestones.
- Liquidity ended Q2 at $859.0 million: Cash and marketable securities increased $61.5 million from a year earlier. The balance gives QuantumScape more time to scale Eagle Line and complete automotive qualification without immediately returning to capital markets.
- 2026 capex guidance fell to $27 million to $37 million: The midpoint declined by $18 million from the prior $40 million to $60 million range. Lower spending extends the runway, though investors still need evidence that cost control does not slow separator and cell industrialization.
What Is QuantumScape (QS)?
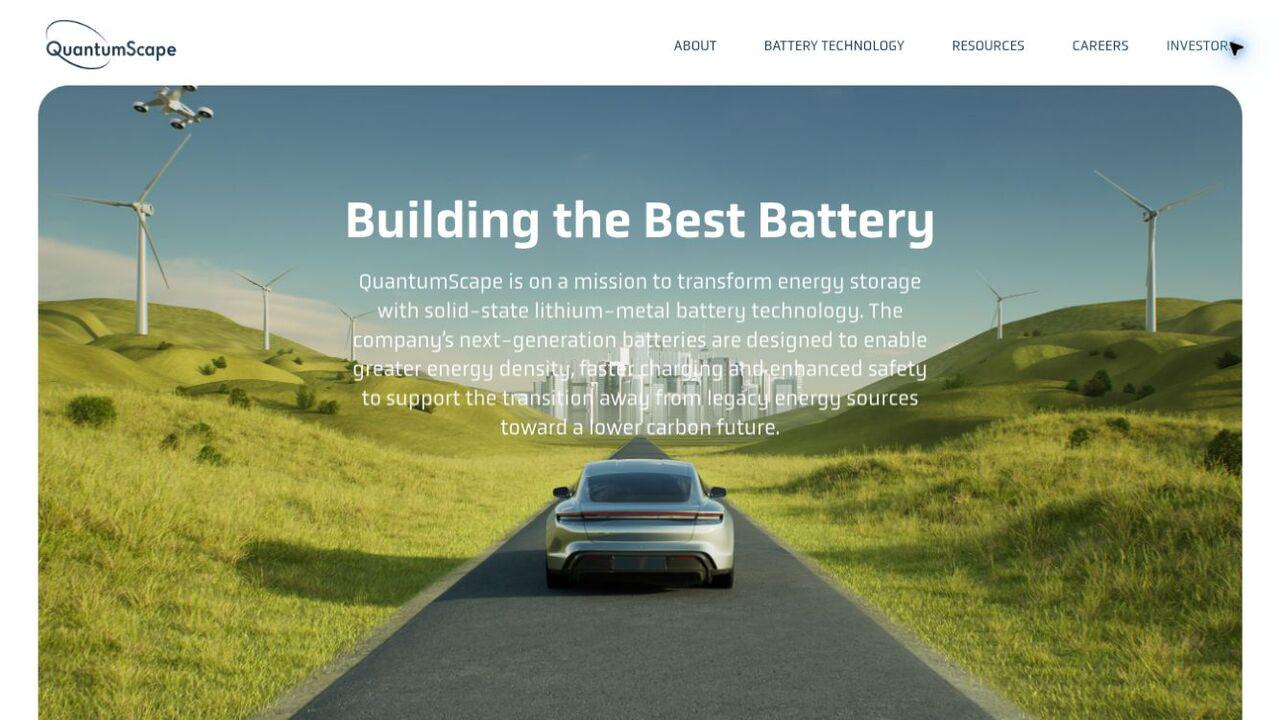
QuantumScape is a battery-development company founded in 2010 to commercialize solid-state lithium-metal cells. Its core intellectual property combines a ceramic solid separator with an anode-free cell architecture, which forms the lithium-metal anode during charging rather than manufacturing one into the cell. The company currently earns little or no GAAP product revenue, so investor value depends on technical milestones, customer-funded development, licensing economics and eventual royalty or production revenue. Automotive applications remain the central market because range, charge time, safety and pack weight can influence vehicle economics.
Its long-term strategy combines internal pilot production with partnerships that can move the technology into automotive-scale factories. PowerCo, Volkswagen Group's battery company, holds a license path and agreed to payments of up to $131 million over two years for joint industrialization work. QuantumScape also works with Honda on automotive evaluation and with Murata Manufacturing and Corning on ceramic-separator scale-up. Eagle Line and the Cobra process are intended to prove repeatable production, while larger-format cells and stationary storage create additional paths beyond the original QSE-5 automotive program.
Read More: Tesla (TSLA) Price Prediction 2026: Can Robotaxi and Optimus Push TSLA Stock to $500?
QuantumScape (QS) Q2 2026 Earnings Overview: Lower Losses and Stronger Billings Extend the Cash Runway
QuantumScape reported a $98.2 million GAAP net loss versus $114.7 million a year earlier, $106.1 million of operating expense and a $64.2 million adjusted EBITDA loss. Customer billings were $10.8 million for Q2 and $21.8 million for the first half, exceeding the $19.5 million generated in all of 2025. Liquidity ended at $859.0 million, while 2026 capex guidance was lowered to $27 million to $37 million. The key tradeoff is better capital discipline against a commercialization schedule that still requires years of execution.
Read More: QuantumScape (QS) Q2 2026 Earnings Overview: $64.2M Loss Sends Shares Down 12.95%
|
Financial Metric |
Guidance / Consensus |
Reported / Actual |
Surprise |
|
Q2 GAAP net loss |
-$114.7M a year earlier |
-$98.2M |
Improved. Narrowed by $16.5M YoY. |
|
Q2 operating expenses |
$123.6M a year earlier |
$106.1M |
Lower. Declined 14.2% YoY. |
|
Q2 adjusted EBITDA loss |
Company expectations |
-$64.2M |
In line. Stayed within the annual plan. |
|
Q2 customer billings |
$19.5M in all of 2025 |
$10.8M; $21.8M H1 |
Advanced. H1 exceeded full-year 2025. |
|
Q2 capex |
$8.6M a year earlier |
$4.6M |
Lower. Declined 46.2% YoY. |
|
Q2 liquidity |
$797.5M a year earlier |
$859.0M |
Higher. Increased $61.5M YoY. |
|
FY2026 adjusted EBITDA loss outlook |
-250Mto-275M prior |
-250Mto-275M |
Reaffirmed. Development spending remains substantial. |
|
FY2026 capex outlook |
$40M to $60M prior |
$27M to $37M |
Reduced. Midpoint fell $18M. |
- The $98.2 million net loss narrowed by 14.4%: The $16.5 million year-over-year improvement shows better cost control, though QuantumScape still depends on future commercialization rather than current earnings. Operating efficiency therefore remains important to extending the runway.
- Operating expenses fell 14.2% to $106.1 million: The decline from $123.6 million helps preserve $859.0 million of liquidity while QuantumScape funds separator scale-up and larger-format development. Lower costs provide more room to reach the next automotive and storage qualification stages.
- First-half billings of $21.8 million surpassed the full-year 2025 total: Partner payments exceeded the prior $19.5 million full-year figure, showing stronger customer engagement. Billings are not GAAP revenue, so investors still need evidence that those programs convert into sustained commercial demand.
- Q2 capex fell 46.2% to $4.6 million: Lower facility and equipment spending supported an $18 million reduction in the annual capex midpoint. Future commercial-scale production will still require partner capital, stable yields, and successful technology transfer.
- Annual adjusted EBITDA loss guidance stayed at $250 million to $275 million: The unchanged range shows that technical progress has not yet materially changed the cash-consumption profile. Milestone timing therefore remains central to how investors value QuantumScape's liquidity and commercialization path.
QuantumScape (QS) 2026 Investment Outlook: $10 Bull Case vs. $3 Bear Case
QuantumScape's 2026 outlook depends on whether separator production, customer qualification, and partner-funded development can move the company closer to commercial-scale battery production. The upside comes from stronger Eagle Line output and broader customer validation, while manufacturing delays, continued losses, and future dilution remain the main risks.
The Bull Case: Stronger Battery Production Progress Pushes QS Toward $10
The Bull Case assumes Eagle Line demonstrates stable Cobra separator throughput and QSE-5 samples meet automotive performance requirements. PowerCo's program, which can provide up to $131 million over two years, converts technical work into larger funded milestones while Honda and other customers broaden validation.
A move toward $10 would require billings to remain above the $21.8 million first-half pace, annual adjusted EBITDA loss to stay within $250 million to $275 million, and liquidity to remain comfortably above $700 million. Repeatable manufacturing yields and customer qualification would matter more than another laboratory record.
The Base Case: Steady Customer Progress Keeps QS Between $6 and $8
The Base Case assumes separator production and customer testing continue advancing, but commercial vehicle revenue remains beyond 2026. Lower capex and $859 million of liquidity protect the runway, while the absence of GAAP revenue limits how far investors can re-rate the stock.
QS could trade mainly between $6 and $8 if annual capex stays within $27 million to $37 million and partner billings continue. Missed qualification dates or liquidity falling below $700 million would weaken the range even if underlying cell performance remains competitive.
The Bear Case: Manufacturing Delays Pull QS Toward $3
The Bear Case assumes ceramic yield, multilayer consistency, or automotive qualification slips again. A longer timeline would extend annual losses near $250 million to $275 million and increase the probability that QuantumScape eventually needs additional equity capital.
A move toward $3 would become more likely if billings decline, Eagle Line output misses internal goals, or partner programs narrow. Fewer validated cells would delay licensing cash flow, increase dilution risk, and reduce the value investors assign to future commercial earnings.
QS Stock Price Forecasts for 2026 By Wall Street Analysts
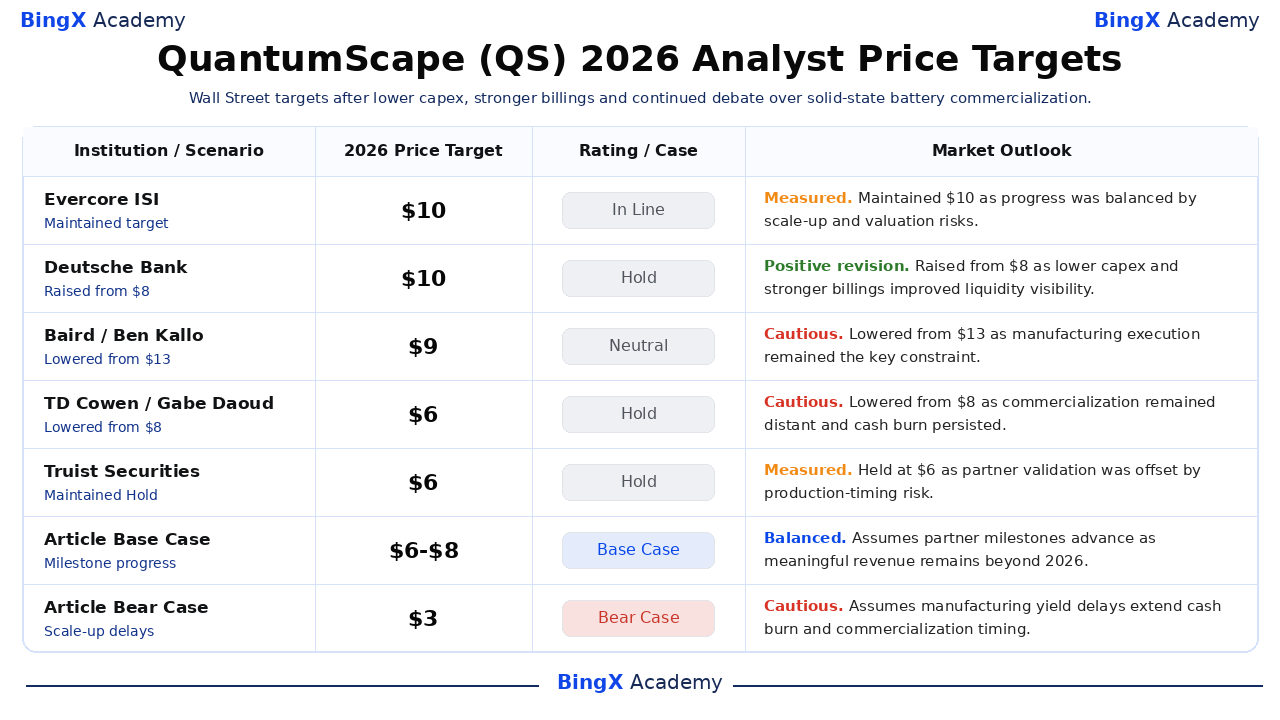
The five dated actions below span $6 to $10 and show how analysts balance partner progress against scale-up risk. The final Base and Bear rows are BingX Academy editorial scenarios and are labeled separately, so they should not be read as institutional research targets.
|
Institution / Scenario |
2026 Price Target |
Rating / Case |
Market Outlook |
|
Evercore ISI |
$10 |
In Line |
Measured. July 28: maintained $10 as progress was balanced by scale-up and valuation risks. |
|
Deutsche Bank |
$10 |
Hold |
Positive revision. July 24: raised from $8 as lower capex and stronger billings improved visibility. |
|
Baird |
$9 |
Neutral |
Cautious. July 24: lowered from $13 as manufacturing execution remained the constraint. |
|
TD Cowen |
$6 |
Hold |
Cautious. July 24: lowered from $8 as commercialization remained distant. |
|
Truist Securities |
$6 |
Hold |
Measured. April 23: partner validation was offset by production-timing risk. |
|
Article Base Case |
6-8 |
Base Case |
Balanced. Assumes partner milestones advance as meaningful revenue remains beyond 2026. |
|
Article Bear Case |
$3 |
Bear Case |
Cautious. Assumes yield delays extend cash burn and commercialization timing. |
How to Trade QuantumScape (QS) Stock on BingX
Trade QuantumScape's battery-industrialization, partner-billings and liquidity outlook using BingX TradFi and BingX AI tools. Because QS can react sharply to sample results, customer agreements and funding changes, traders should define both the catalyst and risk limits before entering a position.
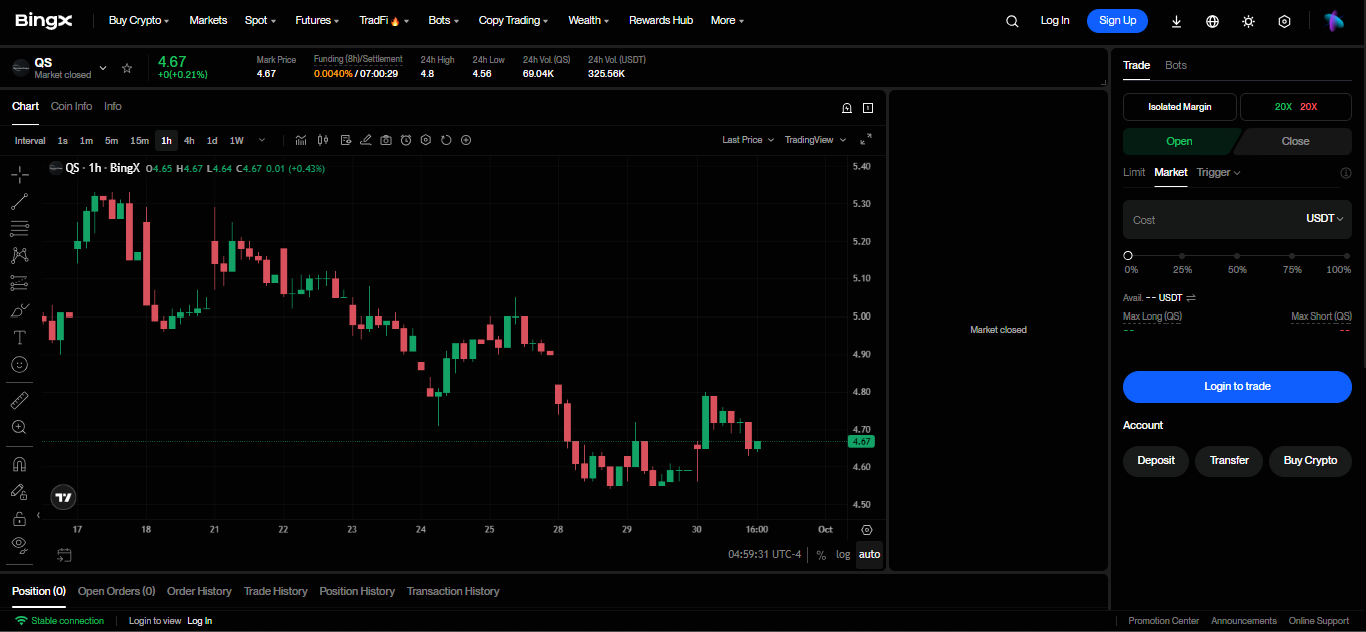
Step 1: Access BingX TradFi. Sign up and navigate to the specialized TradFi section on the BingX exchange dashboard.
Step 2: Select QuantumScape (QS). Search for and select the QS-USDT perpetual futures contract.
Step 3: Choose your direction. Select Open Long if production milestones and partner billings improve. Select Open Short if yield delays or funding risks weaken the outlook.
Step 4: Select leverage and margin mode. Choose Isolated or Cross-Margin based on your risk tolerance. The 52.59% YTD decline shows why conservative leverage and clear position sizing are important.
Step 5: Execute strict risk protocols. Set Take-Profit and Stop-Loss (TP/SL) levels before or immediately after entering the trade. QS can react quickly to cell data, qualification timing, billings and liquidity.
Top 5 Risks to Watch for QuantumScape Investors in 2026
QuantumScape's valuation depends on turning technical milestones into repeatable industrial production. Delays in manufacturing, customer programs, or funding could push cash flow further out and reduce future value per share.
- Manufacturing yield could delay commercialization: A separator that works in the lab still needs to be produced consistently at scale. Lower yields would raise unit costs, slow customer qualification, and push royalty revenue further into the future.
- Annual losses remain high: The $250 million to $275 million adjusted EBITDA loss outlook could reduce the $859 million liquidity balance before meaningful royalties begin. Delayed customer milestones would increase the likelihood of future financing and dilution.
- PowerCo concentration raises execution risk: Up to $131 million of funded work strengthens validation, but setbacks in one major program could materially affect billings, qualification timelines, and expected license income.
- Competing battery technologies continue improving: Better lithium-ion charging, silicon-rich anodes, and rival solid-state designs could narrow QuantumScape's performance advantage before launch. That could weaken pricing power and slow partner adoption.
- Equity dilution can reduce per-share upside: If scale-up requires more capital than partners provide, new shares could spread eventual commercial value across a larger share count. The impact would be greater if financing occurs after another share-price decline.
Final Thoughts: Should You Invest in QuantumScape in 2026?
QuantumScape entered the second half with stronger capital discipline and tangible customer funding. Net loss narrowed to $98.2 million, first-half billings exceeded all of 2025, capex guidance fell and liquidity reached $859 million. Those facts improve survival and validation, but they do not yet prove commercial manufacturing, repeatable automotive yields or durable GAAP revenue from scaled production.
The path toward $10 requires repeatable Eagle Line output, continued partner funding and stable liquidity. The $3 Bear Case reflects yield delays, extended losses and dilution. Conservative traders may monitor billings, separator throughput, automotive qualification and liquidity together before treating a technical milestone as a commercial inflection that can support recurring revenue and positive cash flow.
Risk Reminder: Trading and investing in equities like QS involves a risk of capital loss. Development delays, financing changes and leveraged trading can produce rapid losses. Conduct independent research before allocating capital.
Related Reading
- Tesla (TSLA) Price Prediction 2026: Can Robotaxi and Optimus Push TSLA Stock to $500?
- IonQ (IONQ) Price Prediction 2026: Can Full-Stack Quantum Growth Push IONQ Toward $65?
- Rocket Lab (RKLB) Price Prediction 2026: Can New Rocket and Defense Growth Push RKLB Toward $150?
- Virgin Galactic (SPCE) Price Prediction 2026: Can Delta Testing Push SPCE Toward $5?
- Lockheed Martin (LMT) Price Prediction 2026: Can Record Backlog Push LMT Toward $700?
