
In April 2026, the S&P 500 (SPX) is navigating a high-stakes two-tailed environment. Despite the outbreak of the U.S.-Israeli war with Iran in late February, the index has staged a staggering 8.2% recovery from its March lows, reclaiming the 7,000 level on hopes of a Pakistani-brokered ceasefire. Investors are currently caught between two extremes: Bulls point to a secular growth engine in AI and a projected 17% EPS growth as catalysts for new highs, while Bears warn that a prolonged closure of the Strait of Hormuz and triple-digit oil prices above $110 are creating a complacency trap that masks an impending global recession.
As the Q1 2026 earnings season kicks off, the market's resilience is being tested. With the Federal Reserve frozen by energy-driven inflation and the VIX retreating to 19.5, the fear trade has momentarily subsided. However, with market breadth still under 50%, the rally remains dangerously concentrated in mega-cap tech. This guide breaks down the S&P 500 price prediction for 2026 using data from Goldman Sachs, JPMorgan, Barclays, and Bank of America.
You will also discover how to gain exposure to S&P 500 (SPX) stock futures through BingX TradFi.
Top 5 Things for S&P 500 Investors to Know in 2026
- The 7,000 Milestone: The S&P 500 closed above 7,000 for the first time on April 15, 2026, signaling that investors are looking beyond the initial shock of the Middle East conflict.
- Strait of Hormuz Bottleneck: The world’s most vital oil artery remains throttled. Even with peace talks, the damage to energy infrastructure could keep oil above $100, pressuring corporate margins through Q3.
- The 17% Earnings Floor: FactSet estimates call for 17% earnings growth in 2026. Goldman Sachs argues this fundamental strength provides a safety net against a systemic crash.
- Concentration Risk: Roughly 45% of the recent 8.2% rally was driven by just five stocks. A breadth expansion is required to transform this relief bounce into a durable bull market.
- The Trump Pressure Index: Markets are closely monitoring a combination of approval ratings and inflation expectations, which have historically predicted the administration's pivots toward ceasefire negotiations.
What Is the S&P 500 Index (SPX)?
The S&P 500 Index is widely regarded as the best single gauge of large-cap U.S. equities. It includes 500 leading companies and covers approximately 75% of the total U.S. stock market capitalization. In 2026, the index has become even more tech-heavy, with the top 10 companies accounting for nearly 39% of its total market value.
The index is anchored by global titans that define the modern economy. Tech behemoths like NVIDIA, Apple, Microsoft, and Alphabet (Google) currently command the largest weightings, serving as the primary engines for the AI Multiplier effect. However, the S&P 500’s stability is also reinforced by diverse industry leaders across sectors, including banking giant JPMorgan Chase, retail powerhouse Amazon, and electric vehicle pioneer Tesla. The index also features high-conviction players like Meta Platforms, enterprise software leader Oracle, and legacy hardware giant IBM. This blend of high-growth technology and established blue-chip value is what makes the SPX the ultimate barometer for the health of Corporate America.
As of April 2026, the index is trading at a forward P/E of approximately 20x. While high, this valuation is supported by the AI Multiplier, where AI-related capital expenditure is now responsible for 40% of the index's total earnings growth.
S&P 500's Performance in 2025: A Review
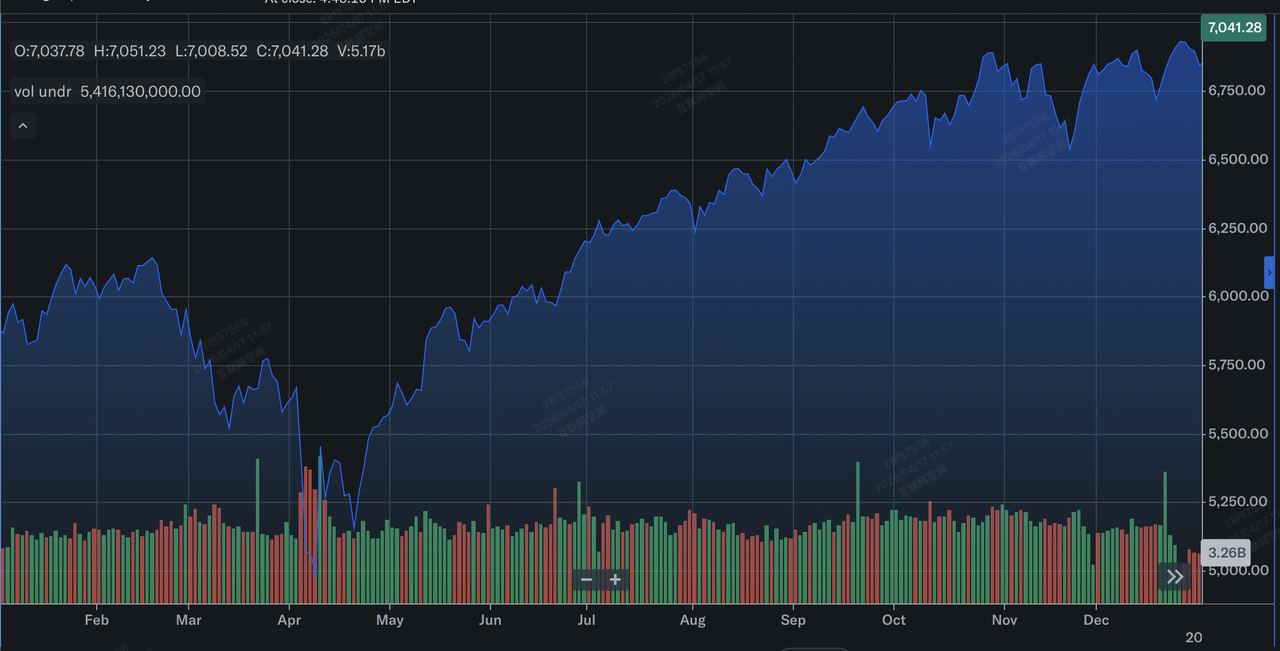
S&P 500 performance in 2025 | Source: Yahoo Finance
In 2025, the S&P 500 demonstrated remarkable resilience, delivering its third consecutive year of double-digit gains with a total return of 17.9%. While the year was marked by significant volatility, including a sharp 19% drawdown in the first half following the introduction of high reciprocal tariffs, the market ultimately powered through to a record-breaking finish. Unlike previous years driven by speculative sentiment, over 75% of the 2025 gains were fueled by robust corporate earnings growth, with earnings-per-share (EPS) rising significantly across the board.
The performance remained heavily influenced by the AI buildout, with Information Technology's 24% gains and Communication Services up 33% leading the sector race once again. While the Magnificent 7 continued to carry the index, 2025 saw a notable broadening of the market; over 30% of S&P 500 members outperformed the index itself, the highest breadth since 2021. This expansion was supported by three Federal Reserve interest rate cuts and an unanticipated surge in AI capital spending, which helped the index nearly touch the 7,000 mark by late December before settling into the strong 2026 start we are seeing today.
Read more: Top AI Tokenized Stocks to Watch in 2026
S&P 500 2026 Strategy: Navigating Volatility
- The AI Secular Trend: Despite geopolitical noise, the tools-and-shovels providers (like NVIDIA and TSMC) continue to post double-digit growth, insulating the tech sector from energy shocks.
- Energy Independence Hedge: The U.S. economy's relative energy independence in 2026 has allowed the S&P 500 to outperform European and Asian indices,which are more vulnerable to $110 Brent oil.
- Technical Support: The 200-day moving average (DMA) near 6,664 remains the critical line in the sand. As long as the 200-DMA is rising, historical data suggests a 100% hit rate for positive returns over the following 12 months.
S&P 500 2026 Investment Outlook: 7,800 Alpha vs. 5,900 Bear Case
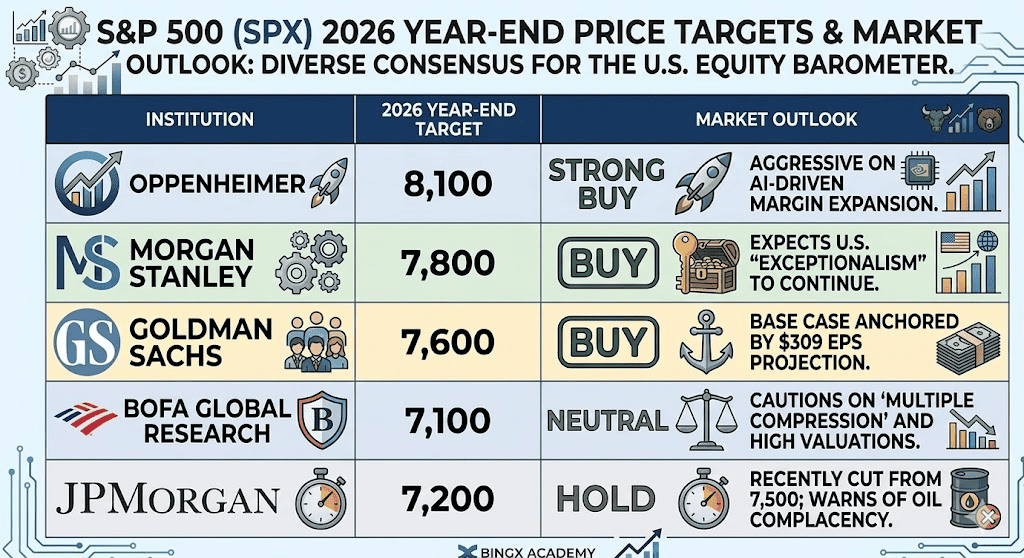
S&P 500 (SPX) 2026 year-end targets by various Wall Street analysts
To navigate the current market uncertainty, investors must weigh these three distinct probability-weighted outcomes for the S&P 500 through the remainder of 2026.
The Bull Case: The 7,800 Peace Dividend Rally
The bullish narrative assumes that the Pakistan ceasefire talks result in a formal reopening of the Strait of Hormuz by June, effectively removing the geopolitical risk premium from the market. In this scenario, the current relief rally transitions into a structural fundamental breakout as energy costs stabilize. Analysts at Morgan Stanley and Deutsche Bank anticipate a marathon broadening where the rally extends beyond mega-cap tech into laggard sectors like industrials and financials. A successful Q1 earnings season, where companies demonstrate the pricing power to pass on energy costs to consumers, would validate the ambitious 17% EPS growth forecast for 2026, setting a solid fundamental floor.
To hit the 7,800 psychological target, the market requires a Goldilocks combination of declining oil prices and a cooling 10-year Treasury yield falling toward 4.0%. In this environment, the AI Multiplier shifts from speculative hype to realized margin expansion, particularly for Magnificent 7 names like NVIDIA and Microsoft. If the Dimon Premium and efficiency gains from enterprise AI scale as projected, the S&P 500 could finish the year roughly 12% higher than current levels. For traders, this scenario rewards high-beta tech exposure and cyclical sectors like Materials and Industrials that have been suppressed by war-related supply chain friction.
The Base Case: 7,400 Sticky Inflation Consolidation
The base case positions the S&P 500 in a period of volatile consolidation as the global economy absorbs the secondary effects of the conflict. This outlook assumes a fragile truce where direct hostilities end, but the Strait of Hormuz remains partially throttled due to naval security concerns and infrastructure damage. Consequently, Brent oil stays higher-for-longer in the $90–$100 range, keeping headline inflation above the Fed’s 2% target. The Federal Reserve likely remains in a frozen posture, providing neither a hawkish headwind nor a dovish tailwind, as it waits for clear signs of disinflation.
In this scenario, the index is expected to drift toward the 7,400–7,500 range, the mean year-end target for UBS and Wells Fargo. Investors will likely pivot toward Quality factors, companies with robust free cash flow and low debt-to-equity ratios, to weather the period of high interest rates. High-multiple growth stocks may undergo a time correction, trading sideways for months to allow earnings to catch up to valuations, rather than suffering a sharp price crash. This is a 'stock-picker's market; where alpha is generated through sector rotation into Consumer Staples and Healthcare rather than broad index beta.
The Bear Case: 5,900 Recession Trigger
The bear case is triggered by a macro-skunk: a sudden re-escalation in the Persian Gulf or a breakdown in ceasefire talks that pushes Brent oil toward the danger zone of $120–$140. JPMorgan and Barclays warn that such a supply-side shock would move from being an inflationary nuisance to a primary driver of demand destruction. As energy costs eat into consumer discretionary spending and corporate margins, the currently projected 17% earnings growth would likely be slashed to zero or negative, forcing a systemic de-rating of equity multiples as recession probabilities jump toward 80%.
Technically, this downside scenario centers on a decisive break below the 200 DMA at 6,664. Such a breach would likely trigger automated selling programs, opening the door for a retest of the 6,000 psychological floor, effectively wiping out nearly two years of market gains. In this hard landing environment, even the AI secular growth engine would struggle to provide a buffer as cloud service providers and enterprise clients scale back multi-billion dollar capex plans. For protection, investors would need to move aggressively into safe-haven assets like Gold and short-term U.S. Treasuries, while utilizing S&P 500 put options or Short Futures to hedge portfolio downside.
Read more: Is Gold a Good Investment in 2026? Risks & Returns Explained
S&P 500 Price Forecasts for 2026 By Wall Street Analysts
|
Institution |
2026 Year-End Target |
Market Outlook |
|
Oppenheimer |
8,100 |
Strong Buy: Aggressive on AI-driven margin expansion. |
|
Morgan Stanley |
7,800 |
Buy: Expects U.S. "exceptionalism" to continue. |
|
Goldman Sachs |
7,600 |
Buy: Base case anchored by $309 EPS projection. |
|
BofA Global Research |
7,100 |
Neutral: Cautions on "multiple compression" and high valuations. |
|
JPMorgan |
7,200 |
Hold: Recently cut from 7,500; warns of oil complacency. |
How to Trade the S&P 500 (SPX) on BingX
Navigate the 2026 volatility using BingX TradFi and BingX AI tools. Whether you are hedging against an oil shock or going long on the AI boom, BingX provides the liquidity and predictive analytics needed to stay ahead of shifting market sentiment. By leveraging AI-driven insights, traders can better anticipate price action and manage risk across the S&P 500's diverse sectors during this high-stakes year.
Long or Short S&P 500 Futures on BingX TradFi
- Navigate to BingX TradFi and select Global Indices.
- Select the SP500/USDT perpetual contract.
- Set your leverage, e.g., 2x–10x. Select Open Long if you anticipate a ceasefire/earnings beat, or Open Short to hedge against $115 oil risks.
- Set Take-Profit (TP) and Stop-Loss (SL) levels based on key support and resistance levels.
Read more: How to Trade Stock Indices With Crypto as TradFi Goes On-Chain in 2026
Top 5 Risks to Watch for S&P 500 Investors in 2026
To successfully navigate the 2026 market, investors must balance the S&P 500's tech-driven momentum against these five critical macro and geopolitical headwinds.
- Energy Inflation Spike: If Brent oil sustains levels above $115, the correlation between stocks and oil will turn sharply negative.
- Breadth Decay: If the rally continues to rely solely on 5-10 stocks, the index remains vulnerable to a flash crash if one titan misses earnings.
- The Fed Wait-and-See: A paralyzed Fed means interest rates will stay restrictive even if growth slows, increasing the risk of a policy error.
- Hormuz Reopening Delays: Any sabotage to the shipping lanes during the peace talks would reset the fear gauge (VIX) back above 30.
- Private Credit Contagion: Rising redemption pressures in shadow banking could spill over into public equity markets.
Final Thoughts: Is the S&P 500 a Buy at 7,000?
The S&P 500 in 2026 is a tale of two markets. On the surface, the index is at record highs, fueled by an insatiable appetite for AI and a flight to safety in U.S. assets. However, beneath the surface, the Strait of Hormuz risk remains a potent threat to global growth. For investors, the 7,000 level represents a psychological crossroads.
Conservative traders may want to wait for a breadth expansion, where more than 50% of stocks participate in the rally, before increasing exposure. Conversely, tactical traders can use the well-defined technical range from 6,664 support to 7,200 resistance to play the volatility. As the April 2026 earnings reports roll in, the math of $309 EPS will ultimately decide if 7,000 is a ceiling or a new floor.
Risk Reminder: Trading indices involves significant risk. The S&P 500 is highly sensitive to geopolitical events in the Middle East, Federal Reserve policy shifts, and energy price volatility. Always perform your own due diligence before trading.
Related Reading
- Goldman Sachs (GS) Price Prediction 2026: Strategic Renaissance or Value Trap at $860?
- JPMorgan Chase (JPM) Price Prediction 2026: Fortress Defense or AI-Driven Alpha at $330?
- Crude Oil Price Forecast 2026: $140 War Premium or $60 Surplus Baseline?
- Is Gold a Good Investment in 2026? Risks & Returns Explained
- How to Trade Stock Indices With Crypto as TradFi Goes On-Chain in 2026