Crypto chart patterns are visual formations on a price chart that signal potential price movements, either a reversal of the current trend or a continuation in the same direction. Traders use chart patterns to identify high-probability entry and exit points, set price targets, and manage risk with defined stop-loss levels. Combined with indicators like RSI (relative strength index), MACD (moving average convergence divergence), and volume analysis, chart patterns form one of the most practical frameworks in crypto technical analysis.
In this guide, you will learn every major chart pattern, what it looks like, what it signals, how to trade it, and how to avoid the most common mistakes.
What Are the Most Important Crypto Chart Patterns: Quick Reference Guide
|
Pattern |
Type |
Signal |
Reliability |
|
Head and shoulders |
Reversal |
Bearish |
Very high |
|
Inverted head and shoulders |
Reversal |
Bullish |
Very high |
|
Double top |
Reversal |
Bearish |
High |
|
Double bottom |
Reversal |
Bullish |
High |
|
Ascending triangle |
Continuation |
Bullish |
High |
|
Descending triangle |
Continuation |
Bearish |
High |
|
Symmetrical triangle |
Continuation (neutral) |
Either direction |
Medium–High |
|
Rising wedge |
Reversal |
Bearish |
High |
|
Falling wedge |
Reversal |
Bullish |
High |
|
Bull flag |
Continuation |
Bullish |
High |
|
Bear flag |
Continuation |
Bearish |
High |
|
Bull pennant |
Continuation |
Bullish |
High |
|
Bear pennant |
Continuation |
Bearish |
High |
What Are Crypto Chart Patterns?
Chart patterns are visual formations created by price movements on a trading chart that reflect market sentiment and trader psychology, essentially displaying the ongoing battle between buyers and sellers. When traders recognise these patterns, they can anticipate potential price movements with greater accuracy.
Support and resistance levels are key components of chart patterns. Certain price points act as psychological barriers where traders tend to make significant decisions, often leading to peaks or troughs in price.
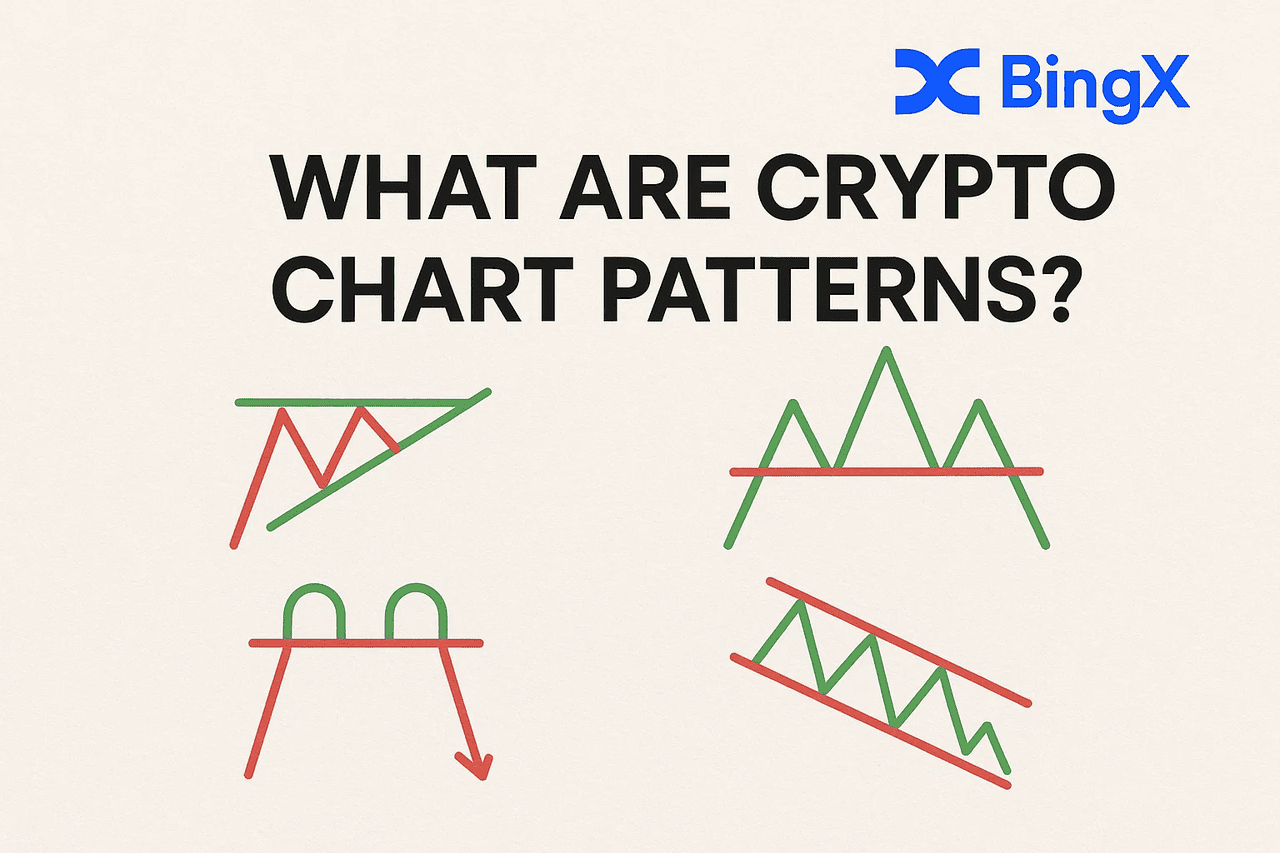
Chart patterns fall into two main categories:
- Continuation patterns - These suggest the current trend is likely to persist after a brief pause. Examples include flags, pennants, and triangles.
- Reversal patterns - These indicate the current trend may be exhausting and price could move in the opposite direction. Examples include head and shoulders, double tops, and wedges.
Reversal vs. Continuation Chart Patterns: Key Differences
|
Reversal Patterns |
Continuation Patterns |
|
|
What they signal |
Trend is ending — direction about to change |
Trend is pausing — will resume same direction |
|
Where they appear |
After an established uptrend or downtrend |
During an established trend |
|
Volume behaviour |
Rising volume on the breakout confirms the reversal |
Decreasing volume during consolidation, spike on breakout |
|
Examples |
Head & shoulders, double top, wedges |
Flags, pennants, triangles |
|
Risk if wrong |
Trend resumes — stop-loss triggered |
Pattern fails, trend reverses — stop-loss triggered |
The Complete List of Crypto Chart Patterns and How to Use Them
Understanding chart patterns is essential if you want to interpret market trends and make more informed trading decisions in crypto.
REVERSAL PATTERNS
1. Head and Shoulders Pattern
The Head and Shoulders pattern is one of the most reliable reversal patterns, with an estimated success rate of 82% according to some analyses. This bearish formation consists of three successive peaks, with the middle peak, also known as the head, being the highest, and the two outside peaks, referred to as the shoulders, being lower and relatively equal in height.
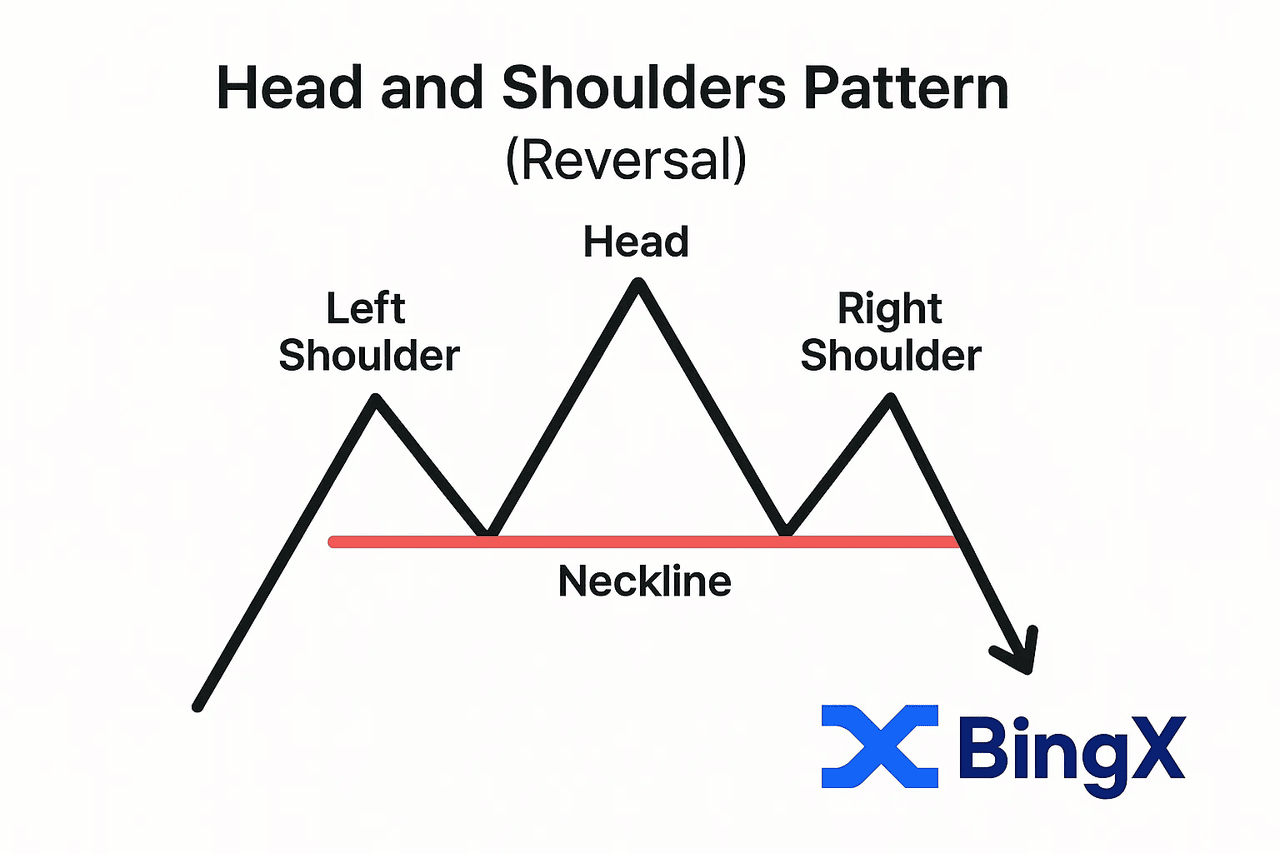
How a Head and Shoulder Chart Pattern Forms
- Forms after an uptrend
- Features three peaks with the middle one being highest
- A horizontal "neckline" connects the lows between peaks
When the price breaks below the neckline after the right shoulder forms, it signals a potential trend change from bullish to bearish. This break is often followed by significant price falls, confirming the reversal. For price targets, traders typically measure the distance from the head to the neckline and project that distance downward from the breakout point.
2. Inverted Head and Shoulders Pattern
The bullish mirror image of the head and shoulders, three troughs where the middle trough (head) is the lowest and the two outer troughs (shoulders) are higher and roughly equal, signalling a downtrend is ending and a reversal higher is imminent.
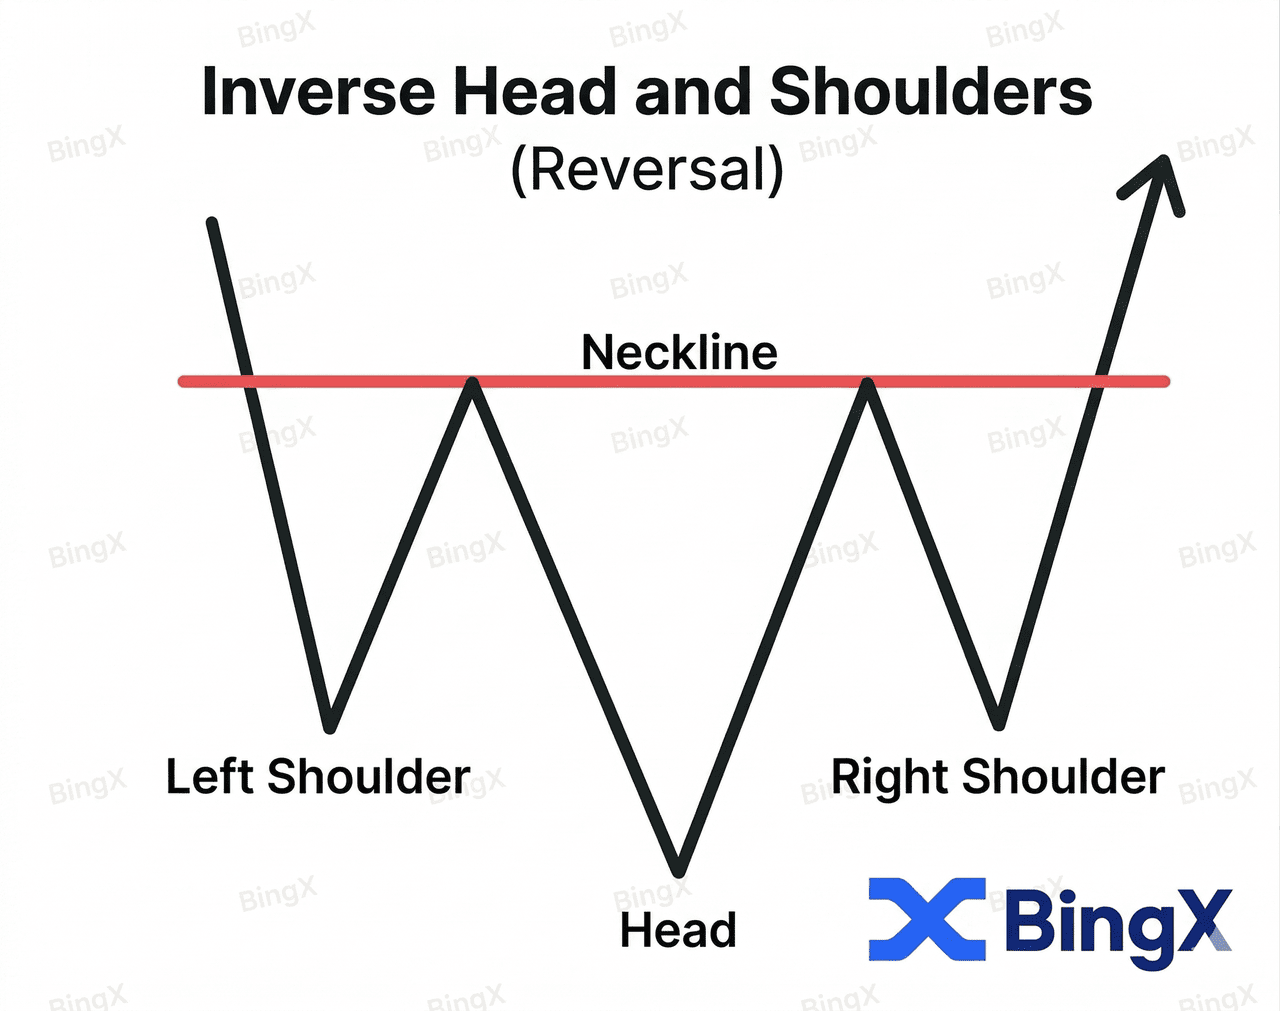
How an Inverted Head and Shoulder Pattern Forms
- Forms after an established downtrend
- Three successive troughs: left shoulder → head (lowest) → right shoulder
- A neckline connects the peaks between each trough
- Volume often picks up noticeably on the breakout above the neckline
Signal: When price closes above the neckline after forming the right shoulder, a bullish reversal is confirmed.
Price target: Measure the distance from the head to the neckline, project that distance upward from the breakout point.
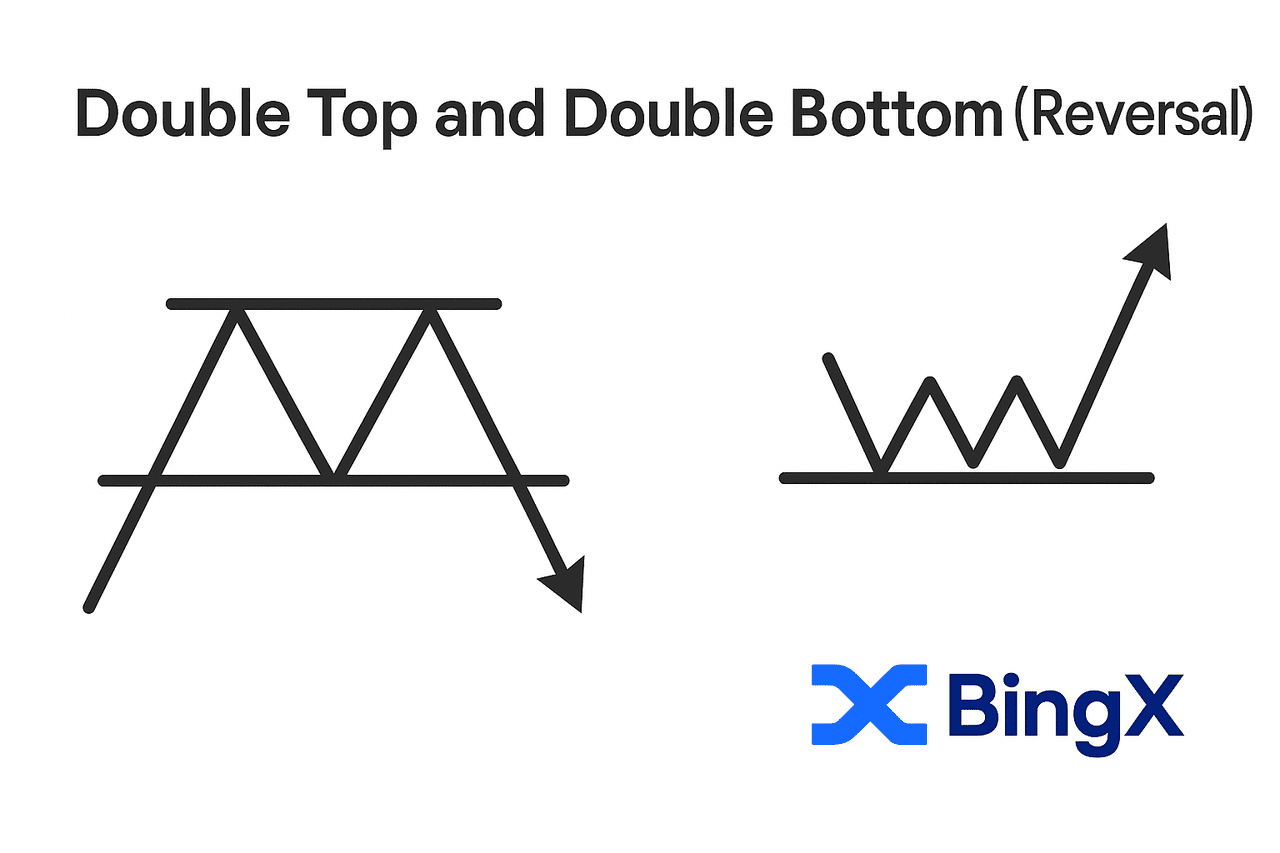
3. Double Top Pattern
A bearish reversal pattern shaped like the letter "M", price hits a resistance level twice but fails to break through, signalling buying pressure is exhausting and a move lower is likely.
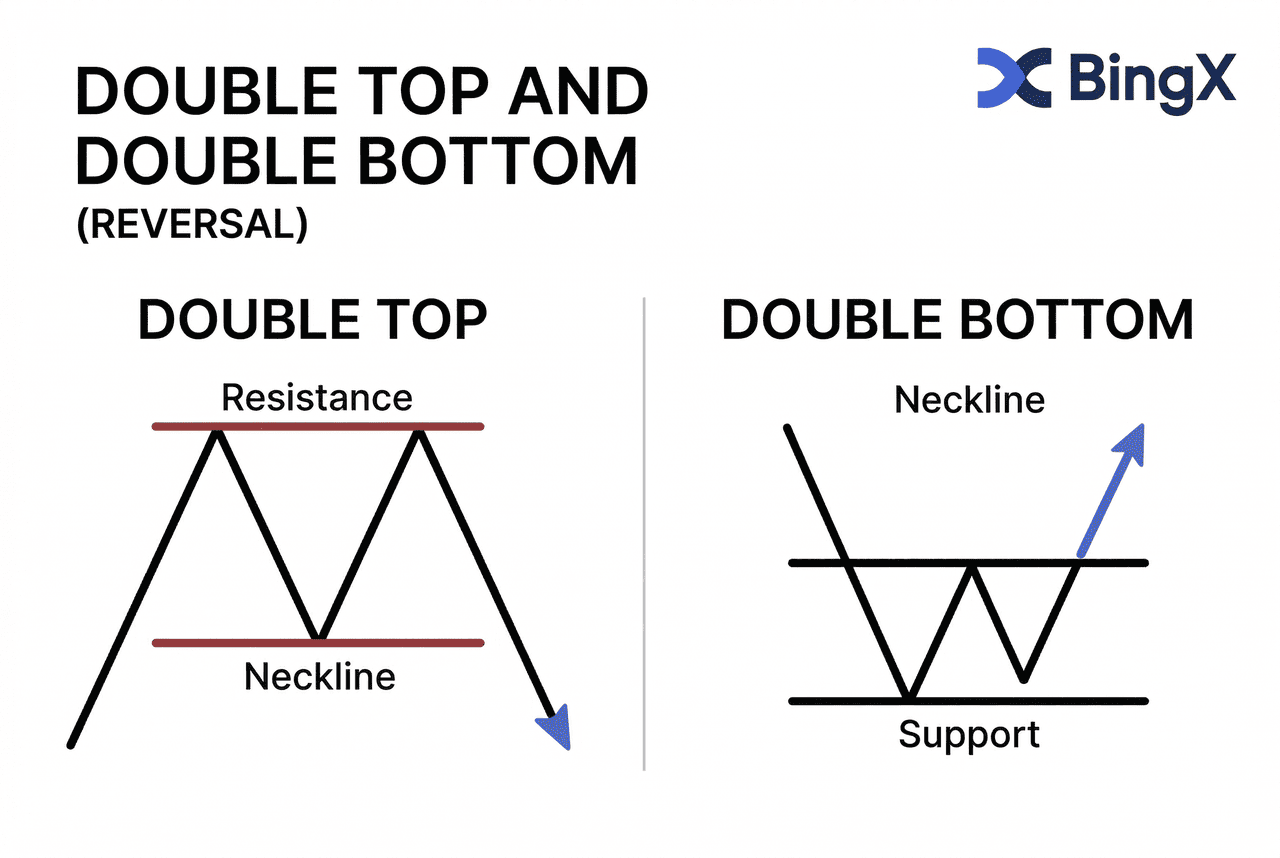
How a Double Top Pattern Forms
- Price rallies to a resistance level, pulls back, then rallies again to the same level
- The second peak fails to exceed the first — sellers defending the level
- A neckline forms at the low point between the two peaks
- Volume is typically lower on the second peak than the first
Signal: When price closes below the neckline (the low between the two peaks), the bearish reversal is confirmed.
Price target: Measure the height from the tops to the neckline, project that distance downward from the breakout.
4. Double Bottom Pattern
A bullish reversal pattern shaped like the letter "W", price tests a support level twice but fails to break lower, signalling selling pressure is exhausting and a move higher is likely.
How Does a Double Bottom Pattern Form?
- Price drops to a support level, bounces, then falls back to the same level
- The second trough fails to go lower than the first, buyers defending the level
- A neckline forms at the high point between the two troughs
- Volume is typically higher on the second bounce than the first
Signal: When price closes above the neckline (the peak between the two troughs), the bullish reversal is confirmed.
Price target: Measure the height from the bottoms to the neckline, project that distance upward from the breakout.
5. Rising Wedge Pattern
A bearish reversal pattern where both support and resistance trendlines slope upward, but the lower trendline rises more steeply, price is making higher highs and higher lows, but the range is compressing, signalling buying momentum is fading.
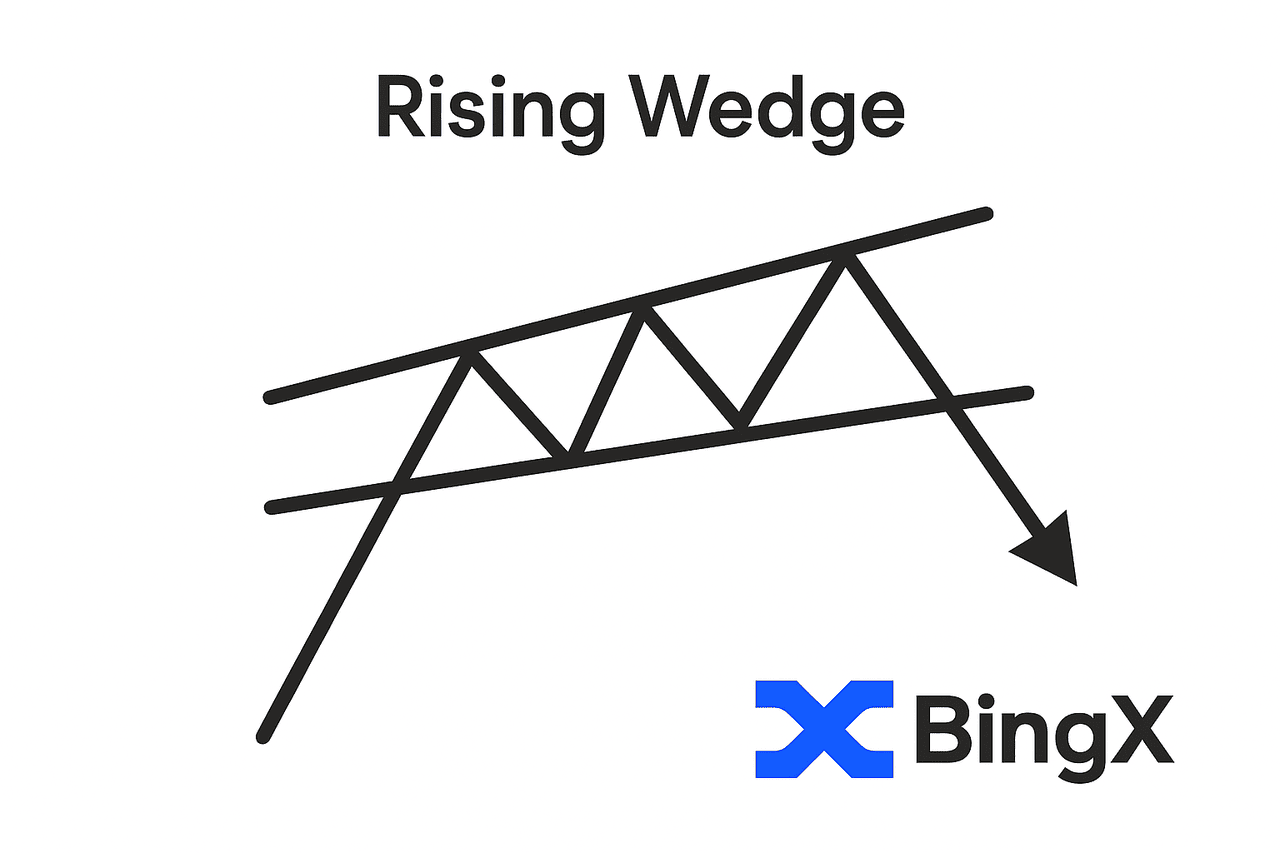
How a Rising Wedge Pattern Forms
- Both trendlines slope upward and converge
- Typically forms during an uptrend
- Volume decreases as the wedge forms
- The lower trendline rises faster than the upper one
Signal: When price breaks below the lower trendline, a bearish reversal is confirmed.
Price target: Measure the height of the widest part of the wedge, project downward from the breakout point.
6. Falling Wedge Pattern
A bullish reversal pattern where both trendlines slope downward but converge, price is making lower highs and lower lows but at a decreasing rate, signalling selling momentum is exhausting and a reversal higher is likely.
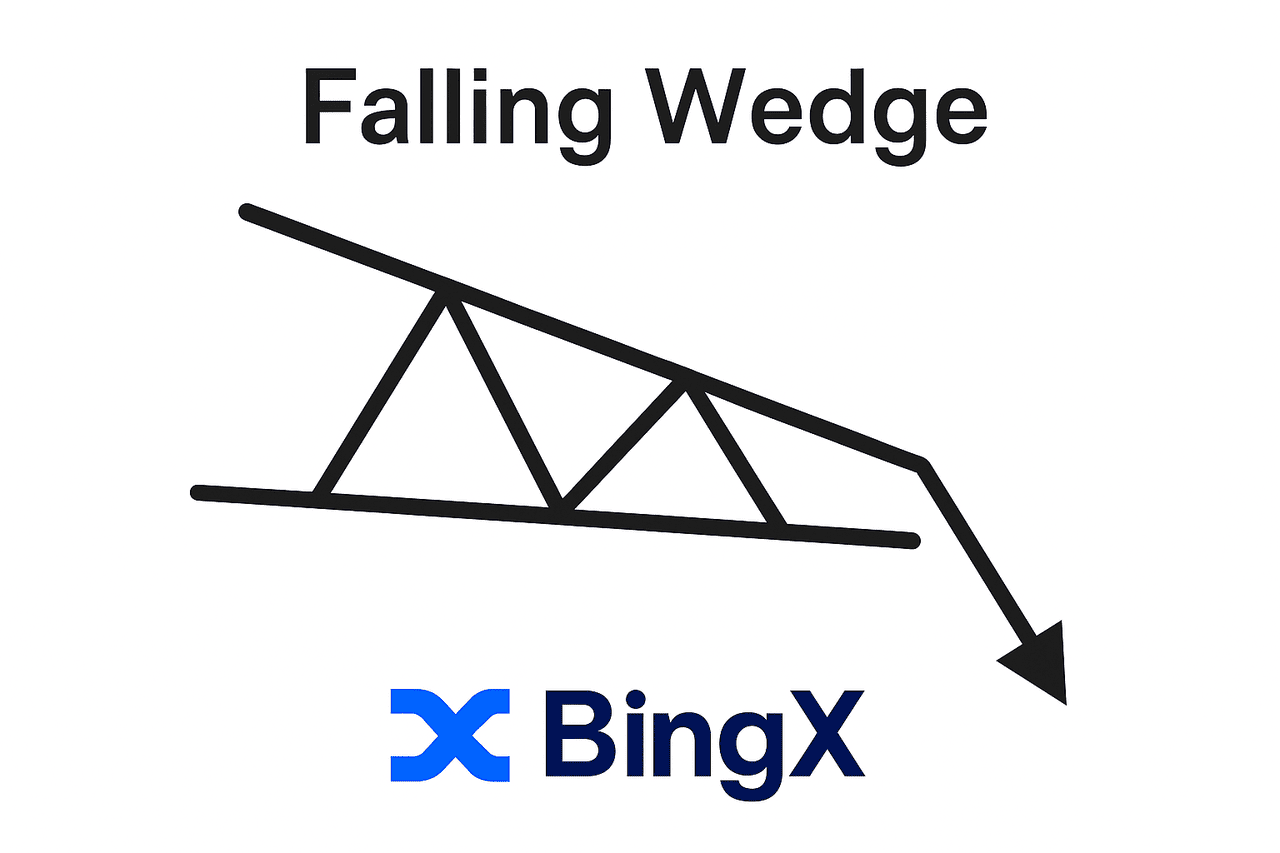
How a Falling Wedge Chart Pattern Forms
- Both trendlines slope downward and converge
- Typically forms during a downtrend
- Volume decreases through wedge formation
- The upper trendline falls faster than the lower one
Signal: When price breaks above the upper trendline, a bullish reversal is confirmed.
Price target: Measure the height of the widest part of the wedge, project upward from the breakout point.
Top Reversal Patterns to Use in Crypto Trading: Quick Reference
|
Pattern |
Shape |
Signal |
Key trigger |
|
Head and shoulders |
3 peaks, middle highest |
Bearish reversal |
Close below neckline |
|
Inverted H&S |
3 troughs, middle lowest |
Bullish reversal |
Close above neckline |
|
Double top |
"M" shape |
Bearish reversal |
Close below neckline |
|
Double bottom |
"W" shape |
Bullish reversal |
Close above neckline |
|
Rising wedge |
Converging upward lines |
Bearish reversal |
Break below lower trendline |
|
Falling wedge |
Converging downward lines |
Bullish reversal |
Break above upper trendline |
CONTINUATION PATTERNS
1. Ascending Triangle Pattern
A bullish continuation pattern with a flat upper resistance line and a rising lower support line, buyers are consistently stepping in at higher prices, building pressure for an upside breakout.
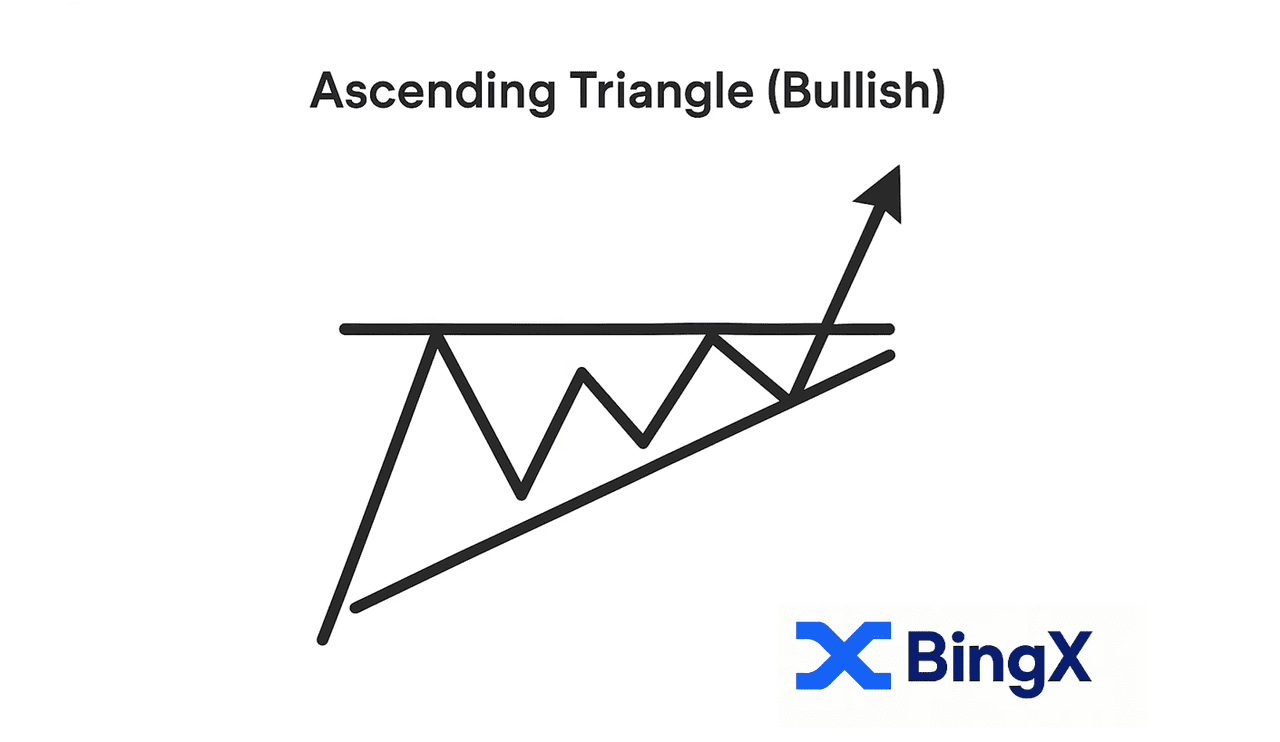
How an Ascending Triangle Pattern Forms
- Flat horizontal resistance at the top, sellers consistently defend this level
- Rising lower trendline, buyers stepping in at higher and higher prices
- Volume decreases through the formation
- Pattern resolves with a breakout above the flat resistance
Signal: When price closes above the flat resistance line with volume, a bullish continuation is confirmed.
Price target: Measure the height of the widest part of the triangle — project upward from the breakout.
Read more: Ascending Triangle Pattern Strategies in Crypto Trading
2. Descending Triangle Pattern
A bearish continuation pattern with a flat lower support line and a declining upper resistance line, sellers are consistently pushing price lower, building pressure for a downside breakdown.
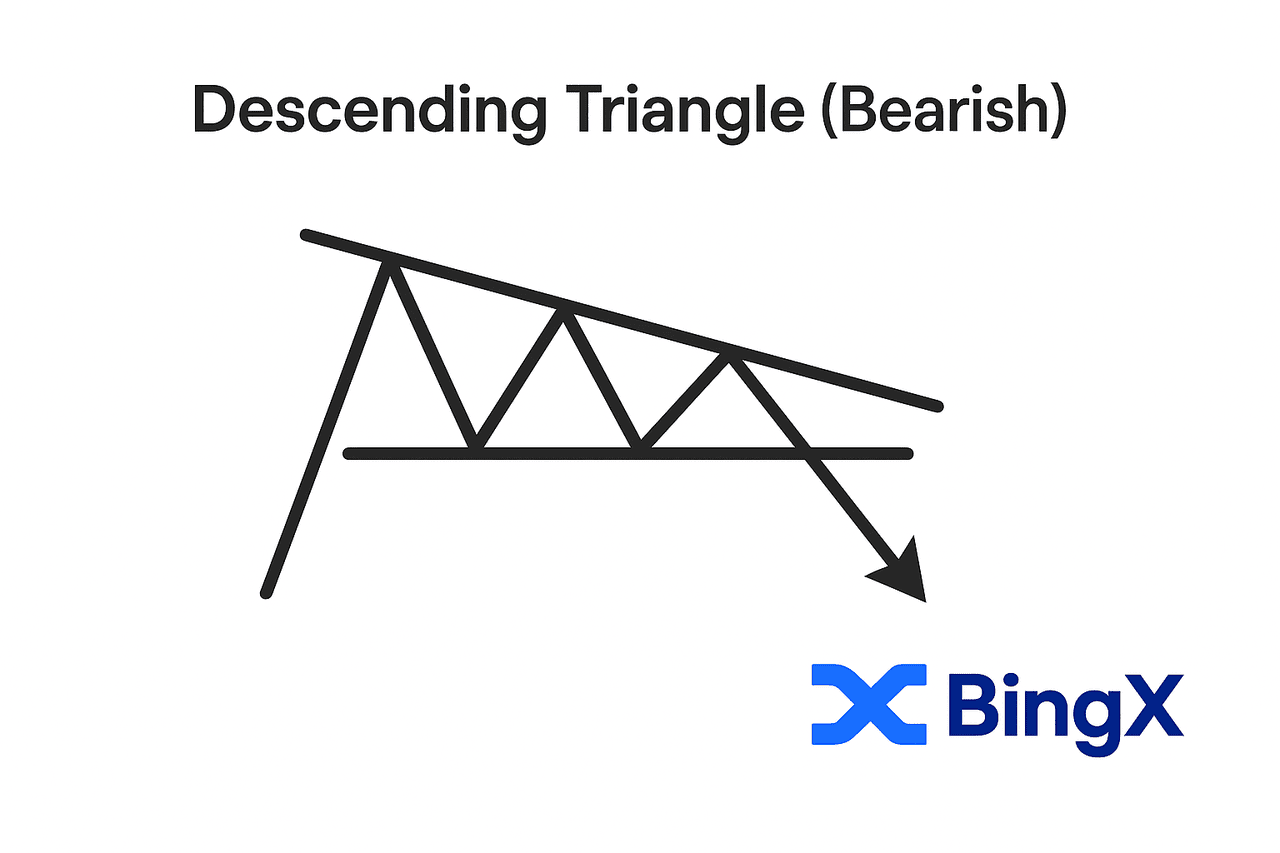
How a Desceding Triangle Chart Pattern Forms
- Flat horizontal support at the bottom, buyers consistently defend this level
- Declining upper trendline, sellers stepping in at lower and lower prices
- Volume decreases through the formation
- Pattern resolves with a breakdown below the flat support
Signal: When price closes below the flat support line with volume, a bearish continuation is confirmed.
Price target: Measure the height of the widest part of the triangle, project downward from the breakdown.
3. Symmetrical Triangle Pattern
A symmetrial triangle is a neutral continuation pattern where both support and resistance trendlines converge symmetrically, neither buyers nor sellers are in control, but the breakout typically follows the direction of the prevailing trend.
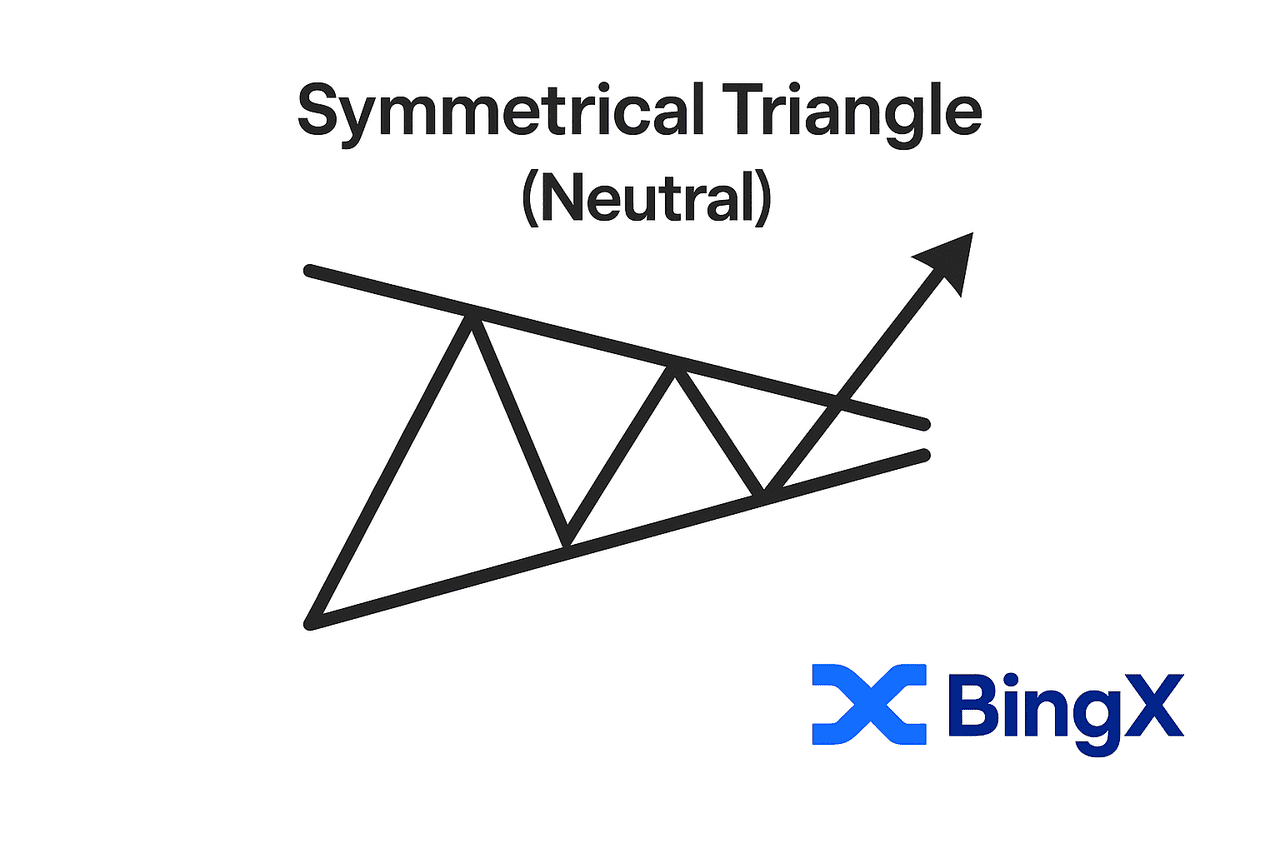
How Does a Symmetrial Triangle Pattern Form on a Chart?
- Both trendlines slope toward each other at roughly equal angles
- Volume decreases as the triangle forms
- Price coils into the apex before breaking out
- The direction of the breakout is uncertain until confirmed
Signal: The breakout direction (up or down) combined with a volume spike confirms the move. In an uptrend, a bullish breakout is more likely. In a downtrend, a bearish breakdown is more likely.
Read more: Understanding the Symmetrical Triangle Pattern in Crypto Trading
4. Bull Flag Pattern
A bull flag is a bullish pattern that appears after a sharp upward move, characterized by a rectangular consolidation phase that slopes slightly downward or sideways against the bullish trend. This pattern signals a potential breakout upwards, indicating a continuation of the uptrend and further bullish momentum.
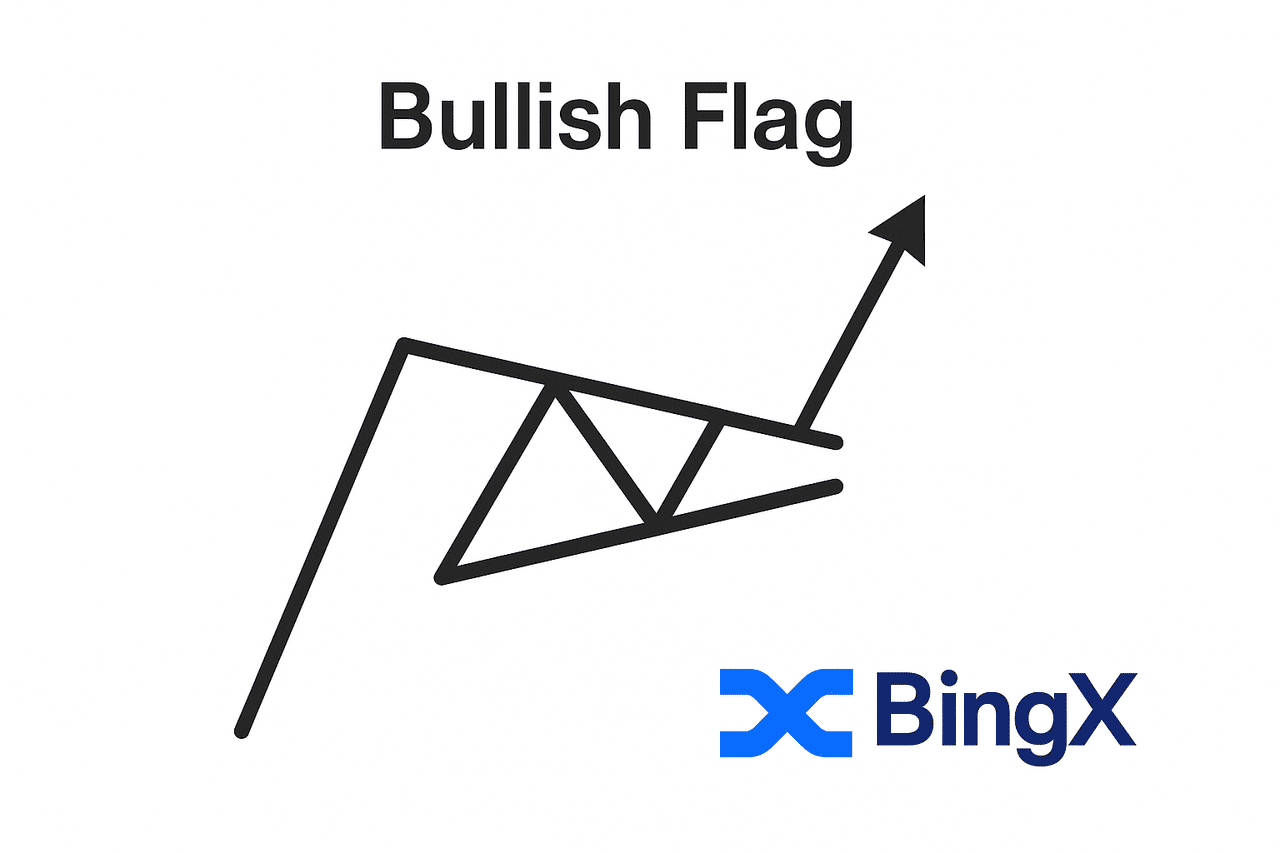
- Signal: Break above the upper trendline of the flag with a volume spike.
- Price target: Project the flagpole's length upward from the breakout point.
Full guide: Bull Flag Pattern: What It Is & How to Trade It in Crypto
5. Bear Flag Pattern
A bear flag, on the other hand, forms during a downward trend. It features a rectangular consolidation that slopes upward or sideways against the bearish trend, signaling a temporary retracement before the trend continues lower.
Traders often look for increased trading volume when the bear flag breaks down, as this confirms the pattern's validity and may prompt them to enter a short position to capitalize on the continuation of the downtrend.
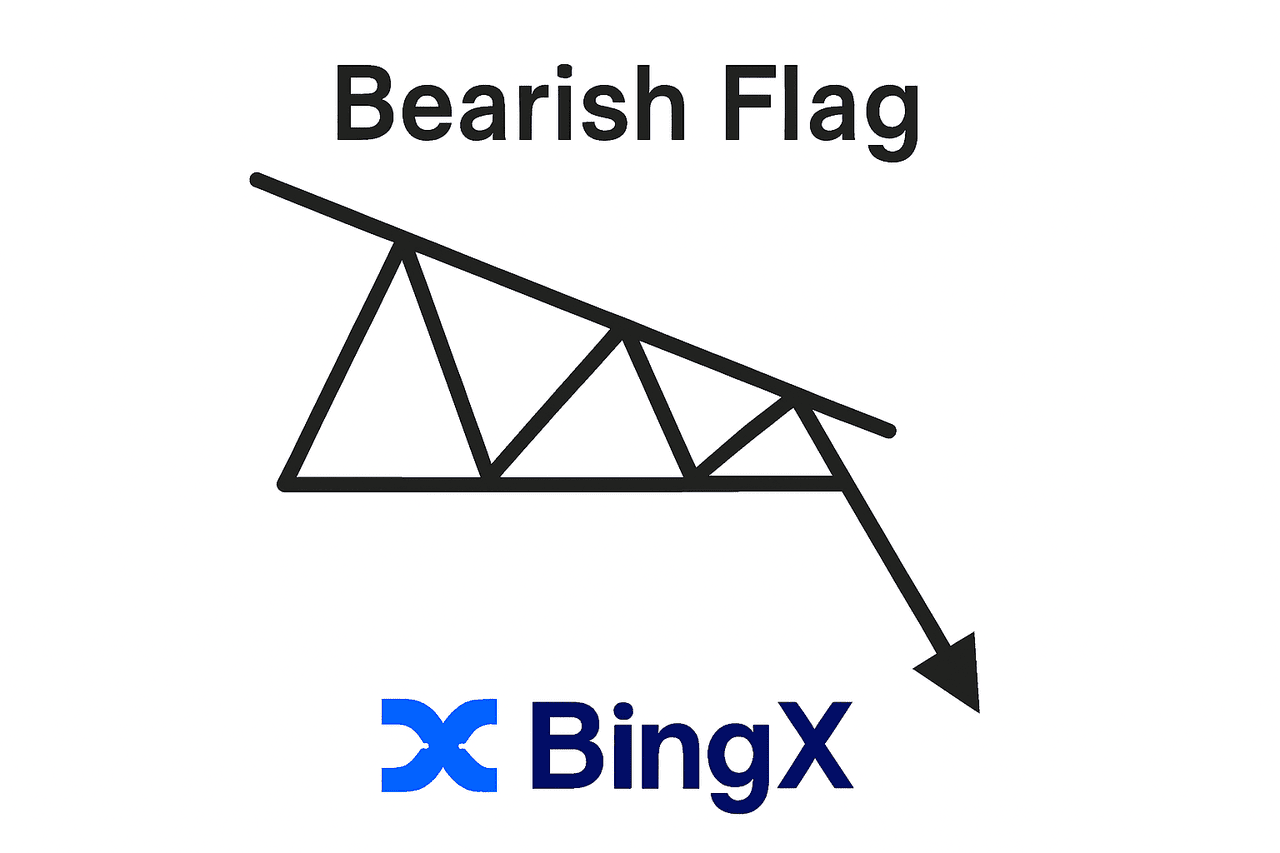
Both bull flags and bear flags resemble a flag on a pole, with the “flag” being the consolidation area. These flag patterns are considered high probability setups for traders, especially when confirmed by increased trading volume.
Full guide: Bear Flag Pattern: What It Is & How to Trade It in Crypto
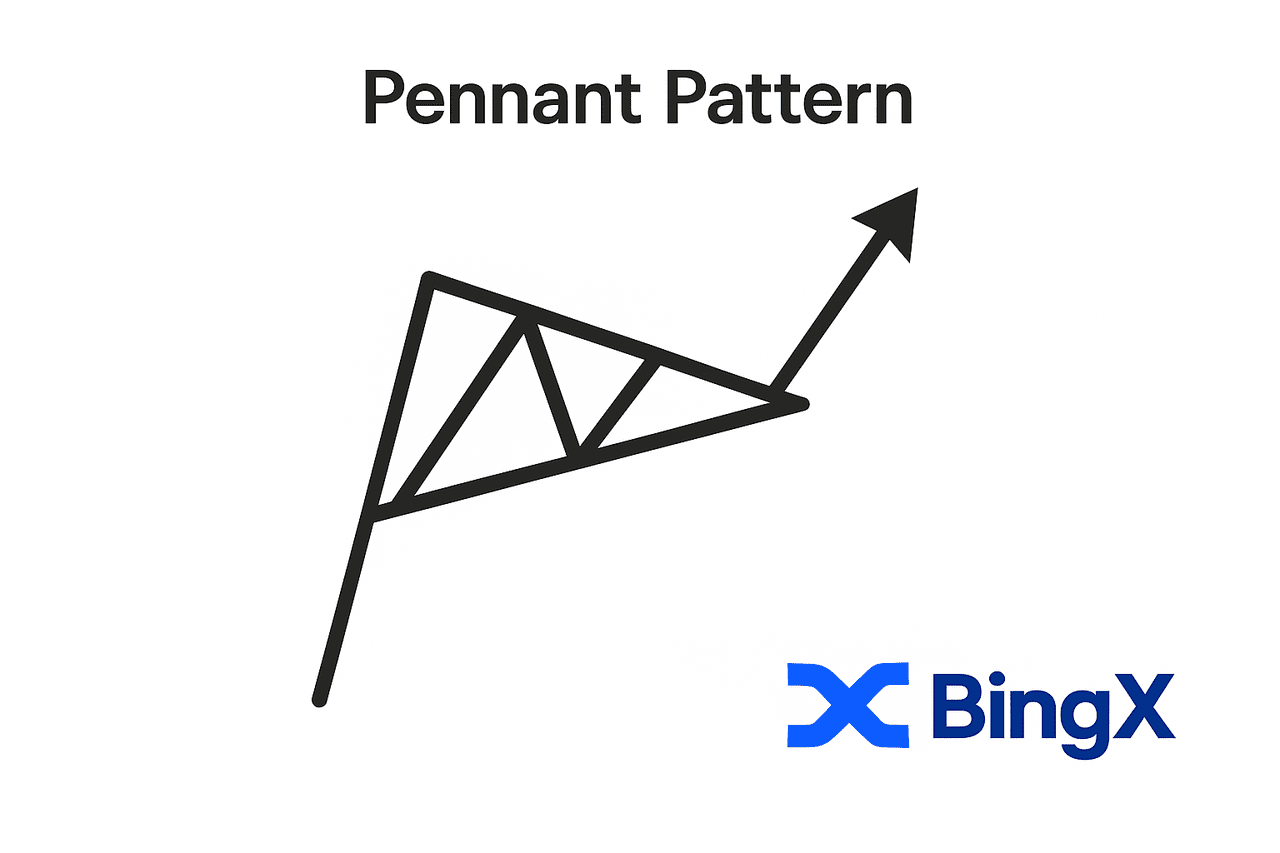
6. Pennant Patterns (Bull & Bear)
Pennants are similar to flags but form a small symmetrical triangle, known as a pennant formation, instead of a rectangle.
A bullish pennant is a bullish pattern that forms after a strong upward price movement, followed by a brief consolidation with converging trendlines. The breakout from a bullish pennant, especially with increased trading volume, is important for confirming the continuation of the bullish trend.
A bear pennant is a chart pattern that shows up after a sharp price drop. It starts with a quick, steep fall called the flagpole, caused by strong selling. Then, the price pauses and moves sideways within narrowing trendlines, forming the pennant.
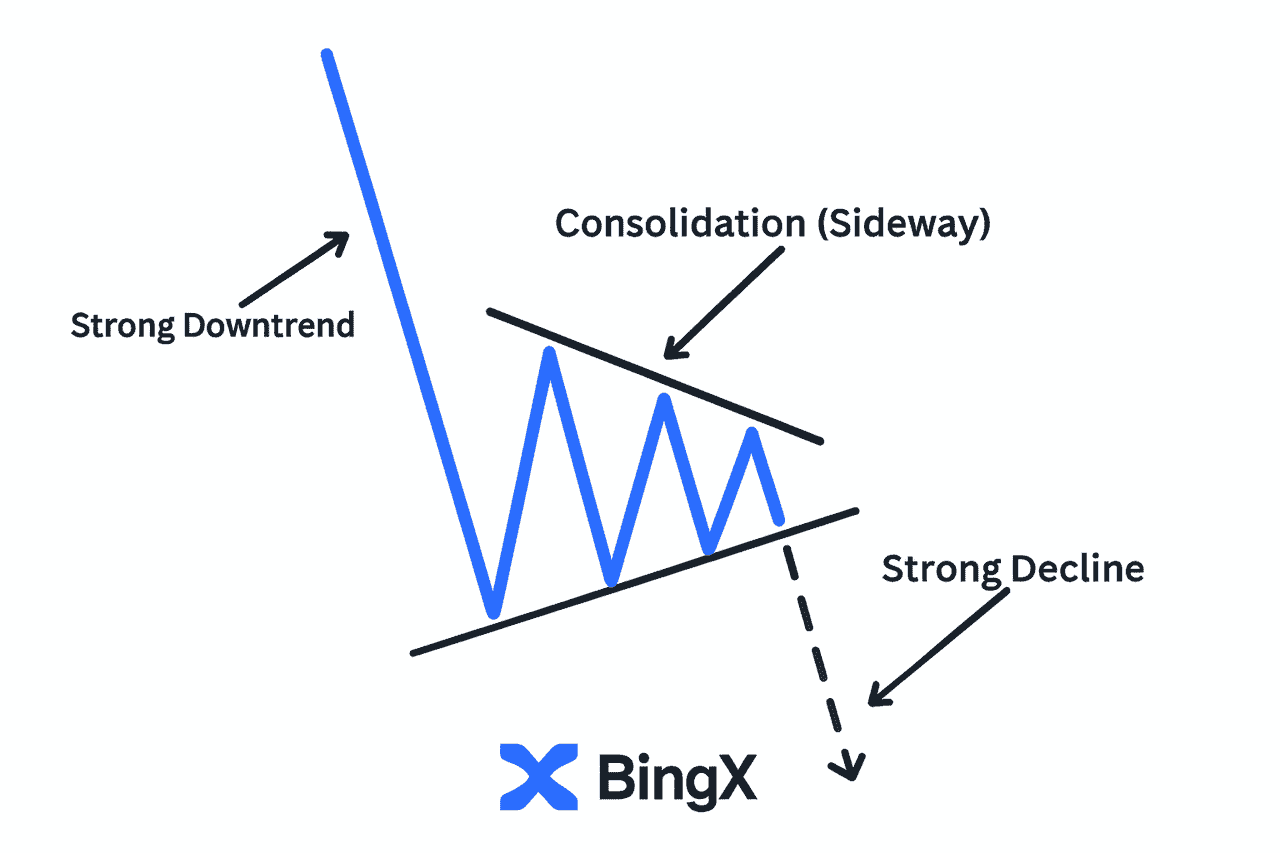
Here’s how a bear pennant is different from a bear flag:
- A bear flag slopes upward and has two parallel lines.
- A bear pennant does not slope and forms a small triangle shape.
When the price finishes consolidating, sellers usually take over again and push the market lower. In crypto, these pennant patterns often last just a few hours or a couple of days because prices move quickly.
Pennant patterns represent brief consolidation in a strong trend and usually result in continuation of the prevailing trend. However, pennant formation can sometimes fail if not confirmed by other technical indicators or if there is low trading volume during the pattern.
|
Bull Pennant |
Bear Pennant |
|
|
Preceding move |
Sharp rally |
Sharp decline |
|
Consolidation shape |
Converging triangle |
Converging triangle |
|
Breakout direction |
Upward |
Downward |
|
Volume at breakout |
Spikes |
Spikes |
Key Differences Between Flags and Pennants
Flags form in parallel channels. Pennants form in converging triangles. Both are traded identically, wait for the breakout in the direction of the original move.
Read more: What Are Bullish vs. Bearish Flag Patterns in Crypto Trading?
Top Continuation Patterns to Use in Trading Crypto: Quick Reference
|
Pattern |
Signal |
Breakout direction |
Volume behaviour |
|
Ascending triangle |
Bullish |
Above flat resistance |
Decreases during, spikes at breakout |
|
Descending triangle |
Bearish |
Below flat support |
Decreases during, spikes at breakdown |
|
Symmetrical triangle |
Neutral (trend-dependent) |
Either direction |
Decreases during, spikes at breakout |
|
Bull flag |
Bullish |
Above upper trendline |
Decreases during flag, spikes at breakout |
|
Bear flag |
Bearish |
Below lower trendline |
Decreases during flag, spikes at breakdown |
|
Bull pennant |
Bullish |
Above upper trendline |
Decreases during, spikes at breakout |
|
Bear pennant |
Bearish |
Below lower trendline |
Decreases during, spikes at breakdown |
Explore Individual Pattern Guides on BingX
Each pattern below has a full dedicated guide with chart examples, entry/exit strategies, and BingX-specific trading instructions:
|
Pattern |
Type |
Dedicated Guide |
|
Bear Flag |
Bearish continuation |
|
|
Bull Flag |
Bullish continuation |
|
|
Inverted Hammer |
Bullish reversal |
|
|
Hammer |
Bullish reversal |
|
|
Shooting Star |
Bearish reversal |
|
|
Morning Star |
Bullish reversal |
|
|
Ascending Triangle |
Bullish continuation |
|
|
Symmetrical Triangle |
Neutral continuation |
|
|
All candlestick patterns |
Mixed |
How to Set Accurate Price Targets Using Chart Patterns
Setting accurate price targets using chart patterns helps you quantify potential upside and downside, allowing you to plan entries, exits, and risk management more effectively.
1. Measuring the Move
The measuring technique is the primary method for establishing price targets from chart patterns. This approach involves:
- For most patterns: Measure the height of the pattern from the highest to lowest point
- Project that measurement: Apply this distance from the breakout point in the direction of the breakout
- Flag and pennant patterns: Measure the flagpole's length and project it from the breakout point
This technique provides a reasonable estimate of how far the price might move after breaking out of a pattern. However, it should be used as a guideline rather than an exact science.
2. Using Support and Resistance as Target Zones
Support and resistance levels play a crucial role in refining price targets:
- Previous support/resistance levels: These often act as magnets for price and can become targets
- Zone approach: Consider targets as zones rather than exact price points
- Multiple confirmations: When a measured move target coincides with a key support/resistance level, it strengthens the target's validity
Traders should be aware that price often reacts to these key levels, either pausing, reversing, or accelerating through them .
3. Accounting for Market Volatility
Cryptocurrency markets are notorious for their volatility, which affects how price targets should be approached:
- Use buffer zones: Add some flexibility to targets rather than expecting exact hits
- Adjust for volatility: Wider targets for more volatile assets and market conditions
- Implement proper stop-losses: Protect against unexpected price movements that invalidate the pattern
- Scale out of positions: Consider taking partial profits at different points
By accounting for crypto's inherent volatility, traders can set more realistic expectations and avoid the frustration of missed targets by narrow margins .
Price Target Method by Pattern
|
Pattern |
Measurement |
Projection direction |
|
Head and shoulders |
Head to neckline distance |
Downward from neckline break |
|
Inverted head and shoulders |
Head to neckline distance |
Upward from neckline break |
|
Double top |
Top to neckline distance |
Downward from neckline break |
|
Double bottom |
Bottom to neckline distance |
Upward from neckline break |
|
Triangle (all types) |
Widest part of triangle |
Direction of breakout |
|
Wedge (rising or falling) |
Widest part of wedge |
Direction of breakout |
|
Flag / Pennant (all types) |
Length of flagpole |
Direction of breakout |
How to Trade Chart Pattern Breakouts: Real BTC Example
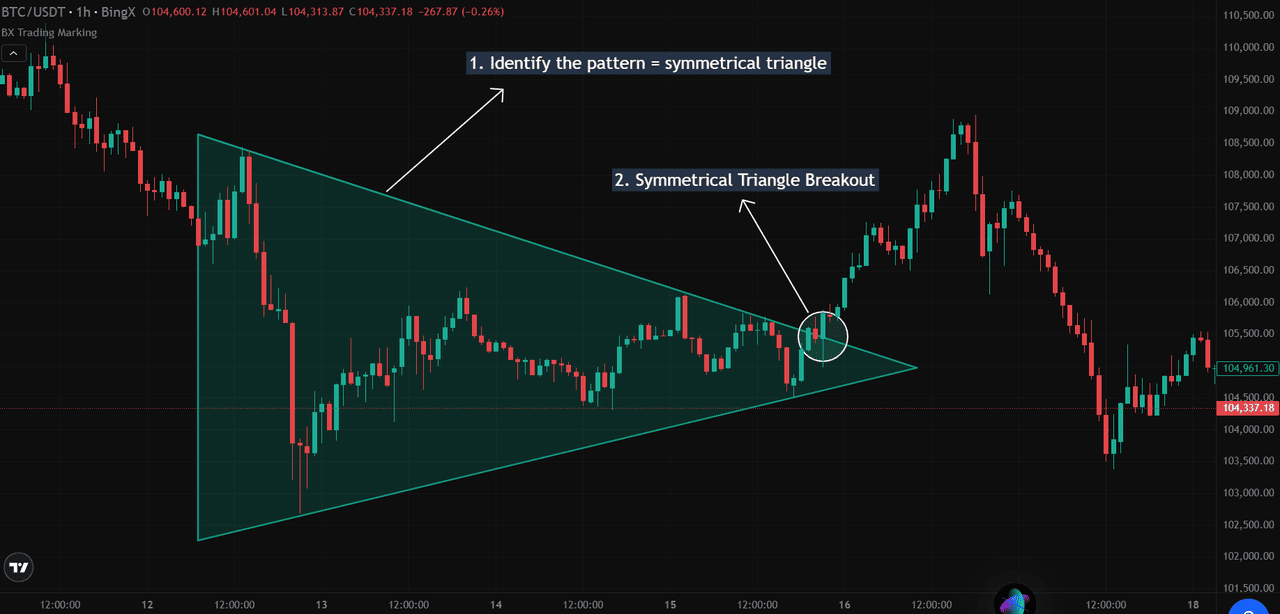
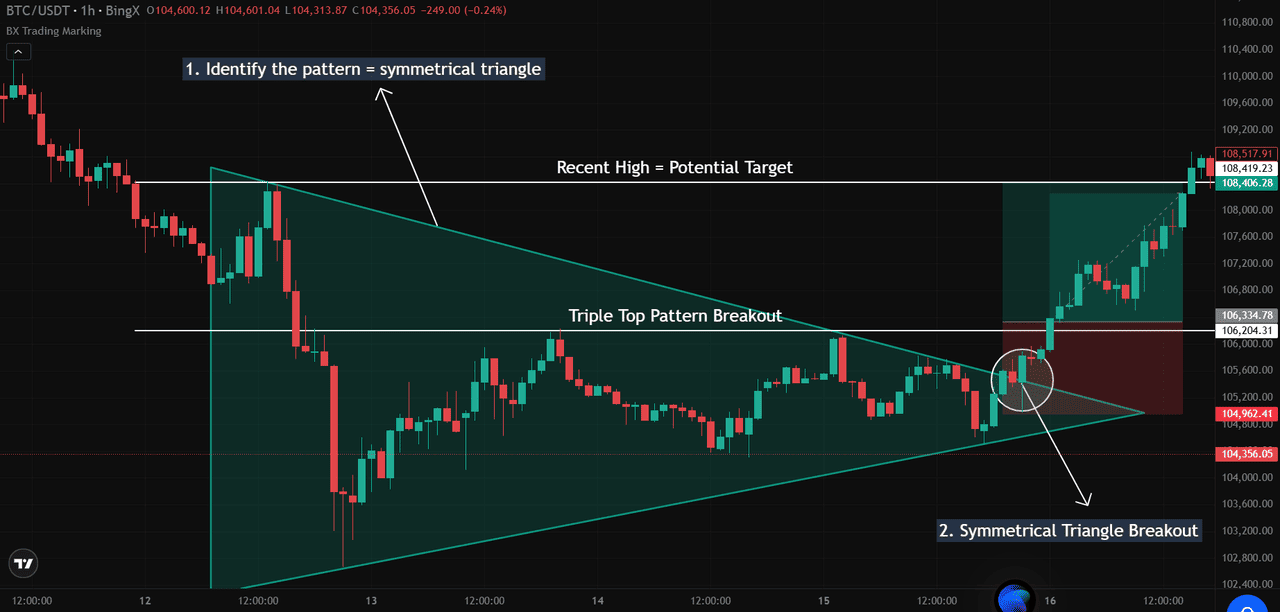
Let’s break down how to use a Symmetrical triangle pattern to project price targets in crypto trading, using a real BTC/USDT chart from BingX on the 1-hour timeframe.
Source: BTC/USDT Trading Chart on BingX
After Bitcoin dropped from around $108,400 to $104,000, it entered a phase of consolidation where price action formed lower highs and higher lows. This created a symmetrical triangle, defined by two converging trendlines sloping toward each other, reflecting indecision in the market.
Volatility tapered off, volume decreased, and traders began anticipating a breakout.
Source: BTC/USDT Trading Chart on BingX
Eventually, BTC broke above the upper trendline at around $105,800–$106,000, confirming a bullish breakout. This was validated by a strong candle close outside the triangle and an increase in volume, key elements traders look for to confirm the move is genuine. At this point, the triangle transforms from a neutral pattern into a bullish continuation setup.
To estimate the target, traders use the height of the triangle and project it from the breakout point. In this case:
- Triangle height = $108,400 − $104,000 = $4,400
- Breakout level = $105,800
- Projected target = $105,800 + $4,400 = $110,200
While Bitcoin didn’t quite reach the full projection, it rallied to $108,517, just shy of a previous high, before reversing.
This illustrates an important trading lesson: price targets are guidelines, not guarantees. Smart traders refine their targets by checking for nearby resistance levels or psychological zones like round numbers. In this setup, the $108,400–$108,500 zone acted as a ceiling for the move.
To manage risk and boost reliability, it’s always helpful to pair chart patterns with other technical tools like the Relative Strength Index (RSI), Moving Average Convergence Divergence (MACD), or volume analysis. These indicators can help confirm momentum and filter out false breakouts. Additionally, placing stop-loss orders just below the breakout point can help protect against potential reversals if the pattern fails.
5 Common Mistakes When Trading Chart Patterns
Even experienced traders fall into these traps. Here are the five most common mistakes and how to avoid them:
- Entering before the pattern is complete: The most expensive mistake. A head and shoulders isn't a head and shoulders until price breaks the neckline. A flag isn't confirmed until price breaks the channel. Acting early exposes you to the full loss if the pattern fails to develop. Always wait for the breakout candle to close outside the pattern boundary.
- Ignoring volume: Volume is the most important confirmation signal for chart patterns. A breakout on low volume has a significantly higher failure rate. Valid breakouts from flags, triangles, and reversal patterns should all be accompanied by a clear volume spike. If volume doesn't confirm the move, treat the breakout with caution.
- Relying on the pattern alone: No chart pattern is reliable in isolation. Always combine with at least one confirming indicator, RSI positioning, MACD momentum, or volume analysis. A head and shoulders at a key resistance level with RSI overbought is a much higher probability trade than the pattern alone.
- Trading against the higher timeframe trend: A bullish pattern on a 15-minute chart means almost nothing if the daily chart is in a strong downtrend. Always check the higher timeframe direction before acting on a pattern. Trade in the direction of the dominant trend wherever possible.
- Setting no stop-loss or placing it too tight: Every chart pattern has a clear invalidation point, where the pattern is broken and the trade thesis is wrong. For a head and shoulders, invalidation is a close above the right shoulder. For a bull flag, it's a close below the lower channel. Place your stop-loss at the invalidation point, not at an arbitrary price.
How to Use Chart Patterns Effectively on BingX
Chart patterns are valuable tools in crypto trading, but they work best when paired with confirmation, context, and risk management. Below is a structured guide to applying patterns, like the symmetrical triangle on the BTC/USDT 1-hour chart, more effectively in live market conditions.
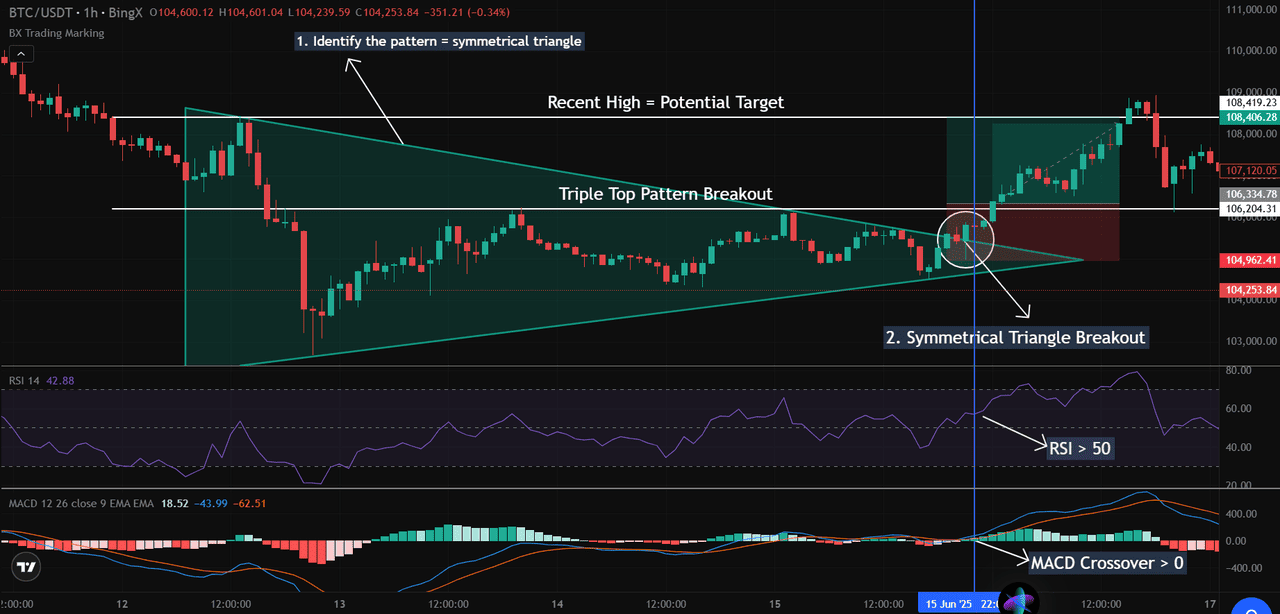
Source: BTC/USDT Trading Chart on BingX
1. Seek Confirmation with RSI and MACD Indicators
A chart pattern is only as reliable as the confirmation behind it. In the BTC breakout example, we saw volume rise alongside price as Bitcoin moved above the triangle’s upper boundary a classic sign of genuine interest from buyers.
Two key momentum indicators provided confirmation:
- Relative Strength Index (RSI) crossed above 50, showing growing bullish momentum.
- Moving Average Convergence Divergence (MACD) printed a bullish crossover above the zero line, strengthening the case for a sustained breakout.
These signals help filter out false patterns that often occur in low-volume environments.
2. Be Aware of Invalidation Levels
Traders should always set clear criteria for when a pattern is no longer valid. For symmetrical triangles, invalidation often occurs when price falls below the last higher low or breaches the triangle’s lower support.
Setting stop-loss orders just outside these zones helps limit downside if the trade fails. In the BTC chart, a reasonable stop-loss could be placed just below $104,800, which would invalidate the breakout structure if breached.
Key risk control actions:
- Identify invalidation zones beneath structural support
- Set stop-loss accordingly
- Use breakout confirmation candles before entry
3. Consider Market Context
Chart patterns do not exist in a vacuum. For the best results, ensure the setup aligns with broader market sentiment and the dominant trend. In this example, Bitcoin’s breakout aligned with a temporary recovery bounce after a strong downtrend, adding context to the pattern.
Also, be mindful of the timeframe:
- Higher timeframe patterns (4H, daily) are generally more reliable
- Shorter timeframes (15M, 1H) are more prone to false signals
- Always zoom out to assess macro direction
4. Practice Proper Risk Management
Even with confirmation and context, no pattern guarantees success. That’s why disciplined risk management is essential. Traders should avoid over-leveraging and size positions based on their risk tolerance and capital exposure.
A smart exit plan can also include:
- Scaling out: Taking partial profits near key resistance levels (like $108,400 in this chart)
- Trailing stops: To lock in gains if the price continues in your favor
- Break-even protection: Moving stops to entry after the first target is hit
Checklist to Review Before Entering Any Chart Pattern Trade
- Pattern is fully formed and confirmed (not still developing)
- Breakout candle has closed outside the pattern boundary
- Volume spikes on the breakout/breakdown candle
- RSI supports the direction (not overbought for longs, not oversold for shorts)
- MACD momentum aligns with the breakout direction
- Higher timeframe trend supports the trade direction
- Stop-loss is placed at the pattern's invalidation point
- Price target is calculated using the flagpole/pattern height measurement
- Risk-to-reward ratio is at least 1:2
Conclusion: Build Confidence Through Mastering Chart Patterns
Mastering chart patterns provides a structured approach to navigating the volatile cryptocurrency markets. While no pattern or analysis method is perfect, understanding these formations gives traders a significant advantage by helping identify potential price movements before they occur.
The key to success lies not in treating chart patterns as guaranteed predictions, but as probability-based tools that provide an edge when combined with proper risk management and a broader understanding of market conditions.
By continually studying how these patterns play out in real market conditions, traders can build confidence in their analysis and develop a disciplined approach to trading that survives the inevitable ups and downs of crypto markets.
Remember that pattern analysis is just one component of a comprehensive trading strategy. The most successful traders combine technical analysis with fundamental research, risk management, and emotional discipline to achieve consistent results in the challenging world of cryptocurrency trading.
Related Reading
- Bull Flag Pattern: What It Is & How to Trade It in Crypto
- Bear Flag Pattern: What It Is & How to Trade It in Crypto
- Inverted Hammer Candlestick Pattern: What It Is & How to Trade It
- Crypto Candlestick Patterns: A Complete Guide for Traders
- Ascending Triangle Pattern Strategies in Crypto Trading
- Understanding the Symmetrical Triangle Pattern in Crypto Trading
- How to Trade the Shooting Star Candlestick Pattern in Crypto
- Morning Star vs Evening Star Patterns in Crypto
- How to Use RSI in Crypto Trading
- How to Use MACD in Crypto Trading
FAQs on Chart Patterns in Crypto Trading
1. What are crypto chart patterns and why are they important?
Crypto chart patterns are visual formations on price charts that reflect market psychology and supply-demand dynamics. They help traders identify potential breakout or reversal points, allowing for more strategic entry and exit decisions in volatile crypto markets.
2. Are chart patterns reliable in crypto trading?
While no chart pattern guarantees a specific outcome, many like head and shoulders, triangles, and flags, have historically shown consistent performance when combined with confirmation indicators (e.g., RSI, MACD) and strong risk management.
3. Can I use chart patterns on lower timeframes like 15-minute or 1-hour charts?
Yes, but with caution. Patterns on shorter timeframes are more prone to false breakouts due to noise and volatility. Higher timeframes (4H, daily) generally produce more reliable signals, especially in trend-based strategies.
4. How do I calculate price targets from chart patterns?
Most patterns use a measuring technique: determine the height of the pattern (or flagpole), then project that distance from the breakout point. Always cross-check with nearby support/resistance zones for better accuracy.
5. What’s the best way to confirm a chart pattern breakout?
Confirmation comes through rising volume, a clean candle closes beyond the pattern boundary, and supporting signals from indicators like the Relative Strength Index (RSI) or Moving Average Convergence Divergence (MACD). Avoid trading patterns without at least one confirming factor.
6. What is the most reliable chart pattern for crypto traders?
The head and shoulders and its inverse are consistently rated among the most reliable chart patterns, with some studies citing completion rates above 80% when the pattern is confirmed by a neckline break and supported by volume. Double tops and double bottoms are similarly well regarded. However, reliability always depends on context — the same pattern carries more weight on a daily chart than a 5-minute chart.
7. What is the head and shoulders pattern?
The head and shoulders is a three-peak bearish reversal pattern where the middle peak (the head) is the highest and the two outer peaks (the shoulders) are lower and roughly equal in height. A horizontal neckline connects the lows between each peak. When price breaks below the neckline after forming the right shoulder, it signals the end of the uptrend.
8. What is a double top chart pattern?
A double top is a bearish reversal pattern shaped like the letter "M." Price hits a resistance level twice but fails to break above it, suggesting buying pressure is exhausting. The pattern is confirmed when price closes below the neckline — the low point between the two peaks. The price target is calculated by measuring the height from the tops to the neckline and projecting that distance downward from the breakout.
9. How many chart patterns are there in crypto trading?
There are over 60 named chart patterns in technical analysis, but most traders focus on 10–15 of the most reliable and commonly occurring ones. The essential patterns to learn first are: head and shoulders, inverted head and shoulders, double top, double bottom, ascending triangle, descending triangle, symmetrical triangle, rising wedge, falling wedge, bull flag, and bear flag.