DefiLlama has solidified its position as the leading open-source analytics platform for decentralized finance (DeFi) and broader blockchain ecosystems in 2026, delivering transparent, real-time data on total value locked (TVL), yields, trading volumes, fees, and protocol performance across hundreds of chains without ads or paid promotions. Launched in 2021 as a community-driven initiative to counter inflated TVL claims from competing trackers, DefiLlama now monitors over $150 billion in DeFi TVL, tracks thousands of dApps and protocols, and serves millions of monthly users with unbiased metrics that have become the industry standard for researchers, investors, traders, and developers.
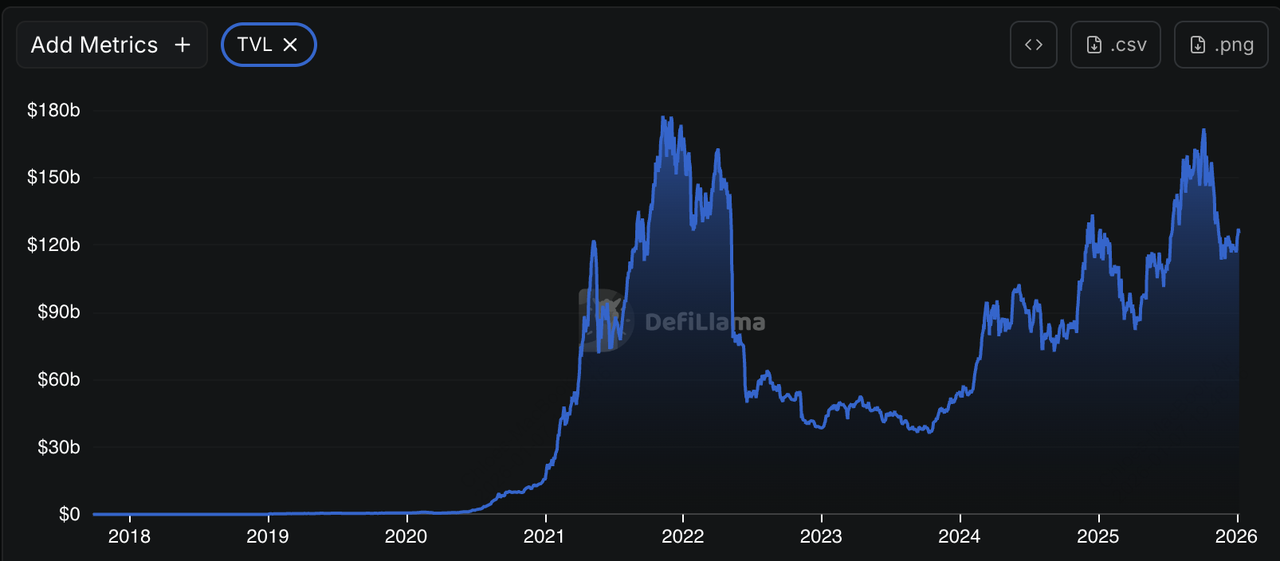
In an era where DeFi daily volumes routinely exceed $20 billion, multi-chain TVL fluctuates with macro trends, and new narratives like restaking, AI agents, and real-world assets (RWA) drive billions in inflows, DefiLlama's commitment to unbiased data practices (excluding double-counted, borrowed, or staked assets for accurate representations) ensures reliable insights amid growing complexity. This guide explores DefiLlama's origins, mechanics, key features, practical usage, and why it remains indispensable for navigating 2026's decentralized landscape.
What Is DefiLlama, DeFi Analytics Dashboard?
Source: DefiLlama
DefiLlama is a comprehensive, community-maintained DeFi and blockchain analytics dashboard that aggregates accurate on-chain data from over 200 networks and thousands of protocols to provide transparent TVL rankings, yield opportunities, volume statistics, funding raises, hack histories, and ecosystem overviews. According to the DefiLlama website, this aggregator tracks a total of 6735 protocols across the decentralized finance ecosystem. It provides data for 503 different blockchains.
The platform monitors 19150 individual pools for yield and liquidity analysis. Revenue metrics are available for 1735 protocols. Additionally, trading volume data is tracked for 977 decentralized exchanges (DEXs). Founded with a strict no-ads, no-paid-listings policy to combat metric inflation prevalent in early DeFi trackers, it has grown into the most trusted source by prioritizing methodological rigor (valuing assets at current prices while excluding leveraged or double-counted positions for true economic representation).
By 2026, DefiLlama has expanded far beyond core DeFi to include NFT marketplaces, cross-chain bridges, oracle networks, governance proposals, treasury breakdowns, and even programming language dominance (Solidity leading at ~70%), making it a holistic resource for understanding interconnected blockchain economies where TVL shifts of $10-20 billion occur weekly amid narrative rotations.
How Does DefiLlama Work?
DefiLlama operates through a decentralized, open-source data aggregation system that directly indexes blockchain nodes and smart contracts using community-contributed adapters tailored to each protocol, calculating TVL by valuing locked assets at real-time market prices while rigorously excluding inflated figures like staked derivatives or borrowed capital to reflect genuine economic activity.
This custom indexer processes vast on-chain records continuously, refreshing metrics frequently and powering interactive charts for historical trends, comparisons, and category breakdowns. The platform's transparency allows users to inspect methodologies, contribute fixes via GitHub, or even fork data, fostering trust in an industry where competitors sometimes include questionable metrics.
In 2026, enhanced features like treasury component visualizations and hack impact trackers pull from public sources, supporting deeper analysis in a multi-chain world with daily volumes in the tens of billions and rapid protocol launches. For example, before rotating from ETH to an emerging L2 token, you check DeFiLlama to see whether TVL, fees, and active users on that L2 are actually trending up or just being momentarily farmed for incentives.
What Are the Key Features of DefiLlama?
DefiLlama boasts an extensive suite of features tailored for DeFi and blockchain analysis, starting with the flagship DeFi Dashboard offering global TVL overviews (Ethereum ~$60B, Tron/Solana close contenders), chain comparisons filtering by EVM, Cosmos, or rollups, and protocol rankings with metrics like inflows/outflows.
Additional tools include
1. Yields ranking pools by APY with treemaps for market share visualization,
2. Airdrops tracking tokenless protocols,
3. Treasuries displaying protocol holdings in detail,
4. Oracles overview for data feeds,
5. Categories breaking down subsectors (DEXs, lending, liquid staking),
6. Volumes/Fees/Revenue for trading and network economics,
7. Liquidations monitoring at-risk positions,
8. Raises cataloging funding rounds with amounts and investors,
9. Stables tracking 150+ stablecoins,
10. Hacks history with monthly losses (bridges often highlighted),
11. Bridges for cross-chain volume/inflows,
12. NFTs for collections/marketplaces,
13. Governance for proposal counts, and
14. Languages showing smart contract dominance (Solidity at 70%+).
All accessible via a clean left-side menu with customizable filters and exports in 2026. Some key features of DefiLlama:
• Poised to adapt to new trends and user demands
• May introduce advanced features like predictive analytics
• Could deepen integration with blockchain data
• Increasing need for effective analytics as the ecosystem grows
• Remains an essential resource for DeFi participants
How to Use DefiLlama Effectively
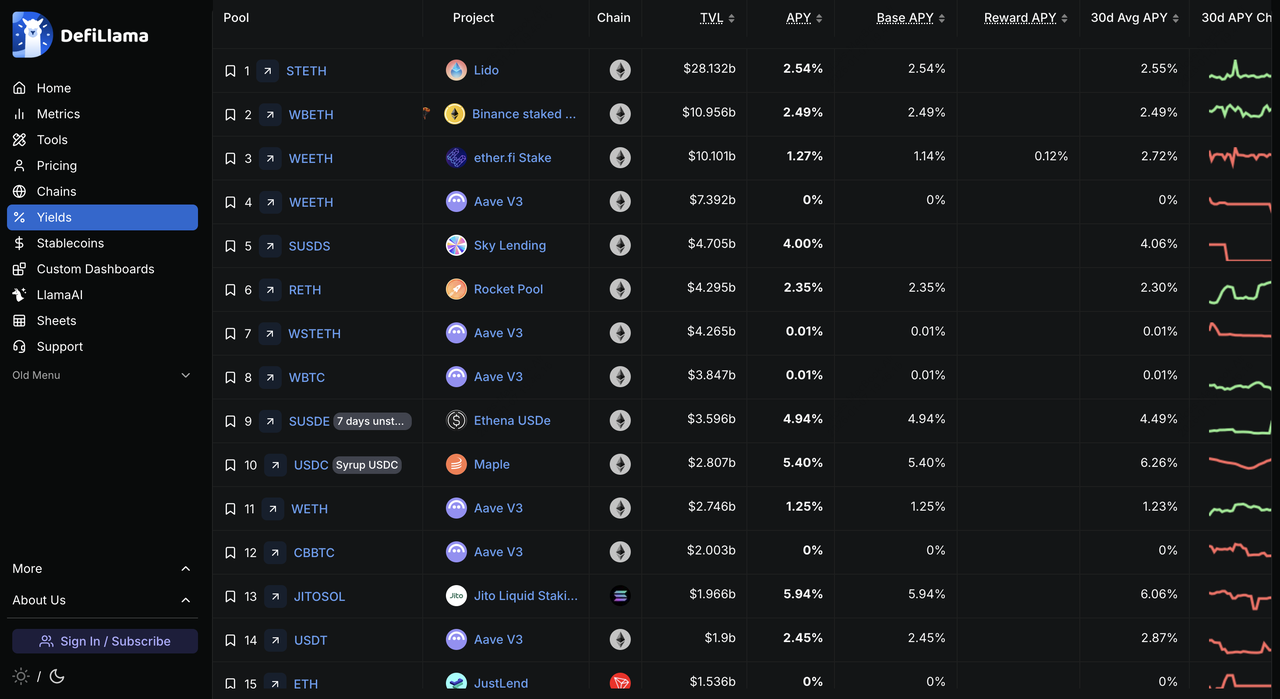
Source: DefiLlama Yields
To maximize DefiLlama, begin with the homepage for quick TVL snapshots and protocol rankings, then use the left menu to drill into specific dashboards (apply filters for chains, categories, or timeframes to uncover trends like Solana's TVL surges or bridge volume shifts).
Leverage Yields for high-APY farming with outlook scores, Chains Compare for cross-network fee/revenue analysis, Raises for funding diligence (tracking $ billions in 2025 rounds), and Hacks for security awareness amid rising exploits.
Bookmark custom views, export CSV data for spreadsheets, contribute protocol adapters via community channels, and combine with on-chain tools for deeper research in 2026's interconnected ecosystems.
How to Use DefiLlama: Step-By-Step Guide
DefiLlama features a straightforward structure where all dashboards can be accessed from the left menu while charts, rankings, and tools related to each selected dashboard show up on the main screen, enabling seamless exploration.
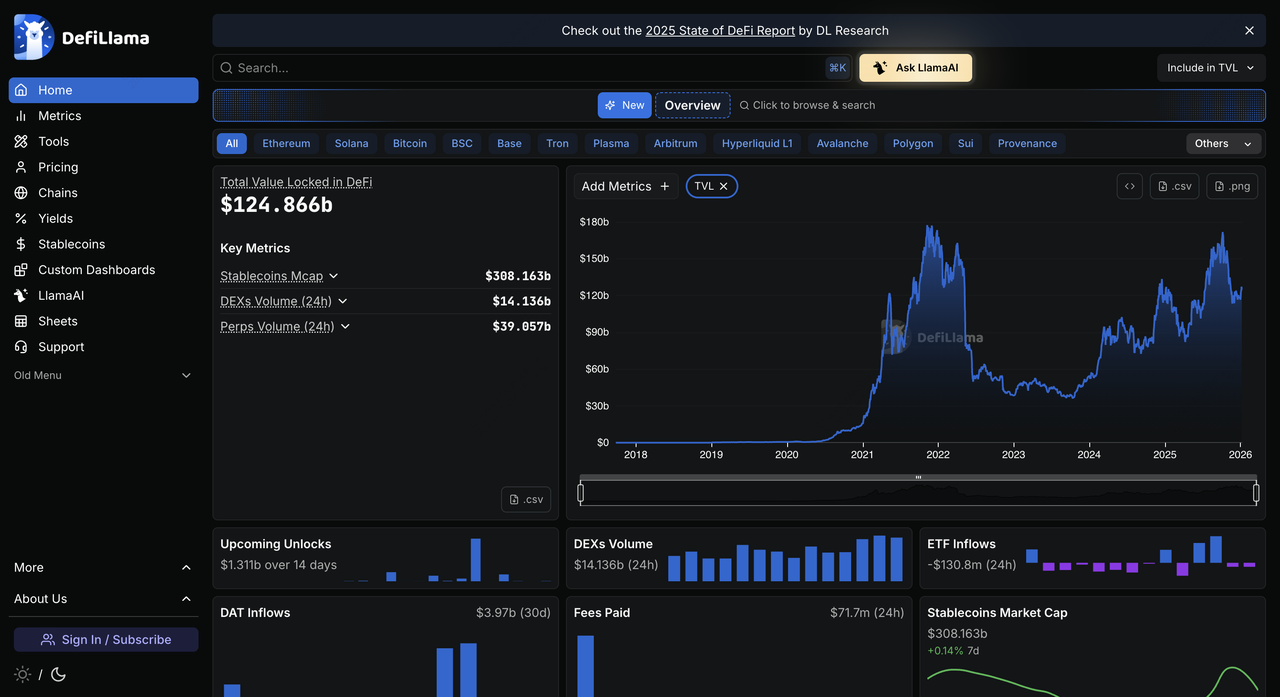
Step 1: Visit the DefiLlama Homepage
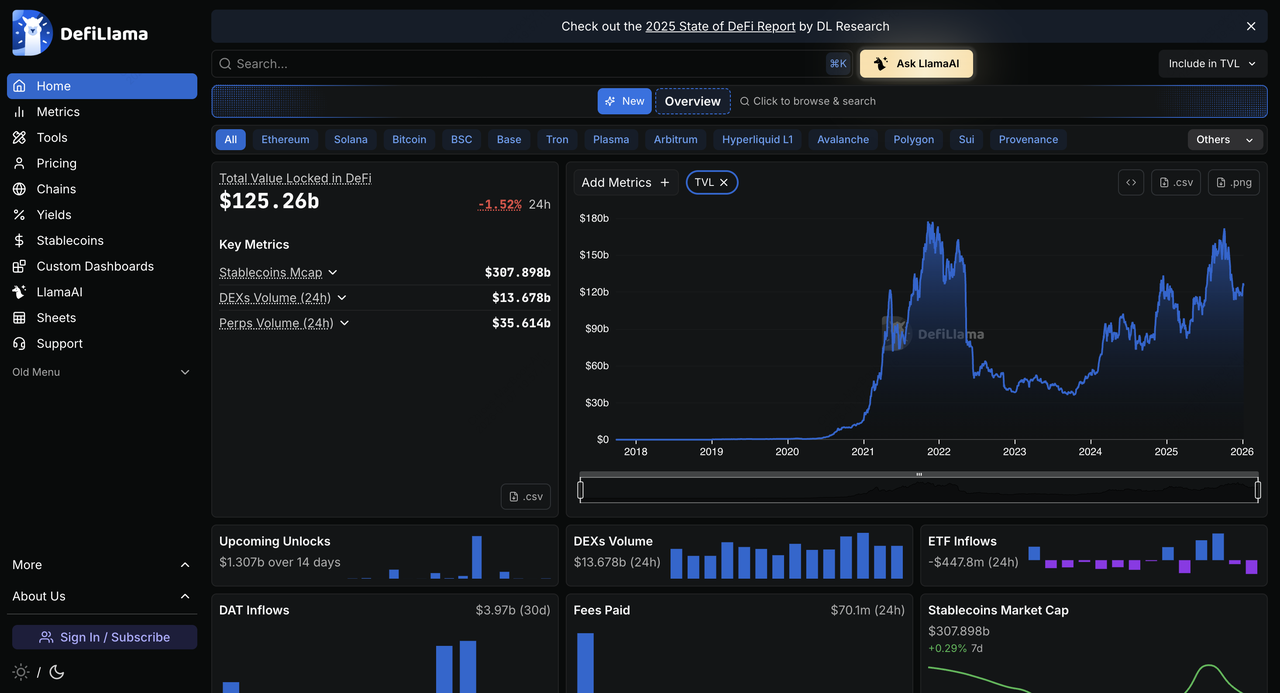
Navigate to defillama.com for the DeFi Overview with global TVL chart, protocol rankings, and quick metrics. Open DeFiLlama to verify whether the project's TVL, fees, active chains, and user activity are growing or shrinking. Compare its metrics with competitors to avoid dead or hype-only protocols.
Step 2: Explore the DeFi Dashboard
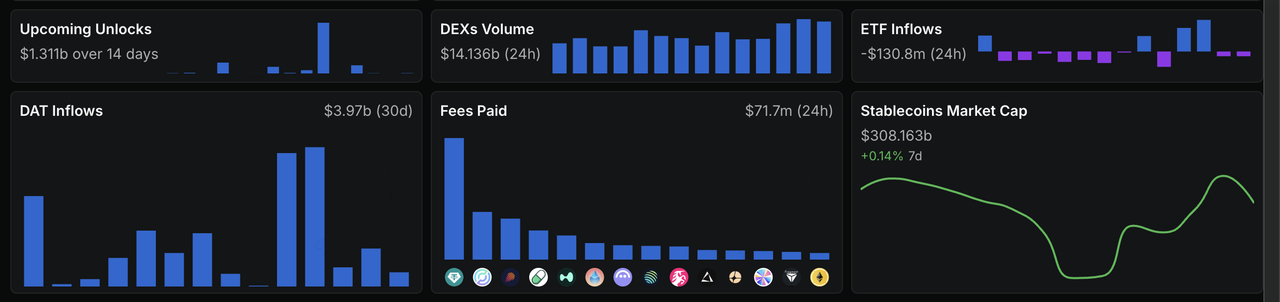
View TVL breakdowns by chain/protocol, add overlays like volume/stablecoins, and sort rankings tables by inflows or category.
Step 3: Check Chains and Comparisons
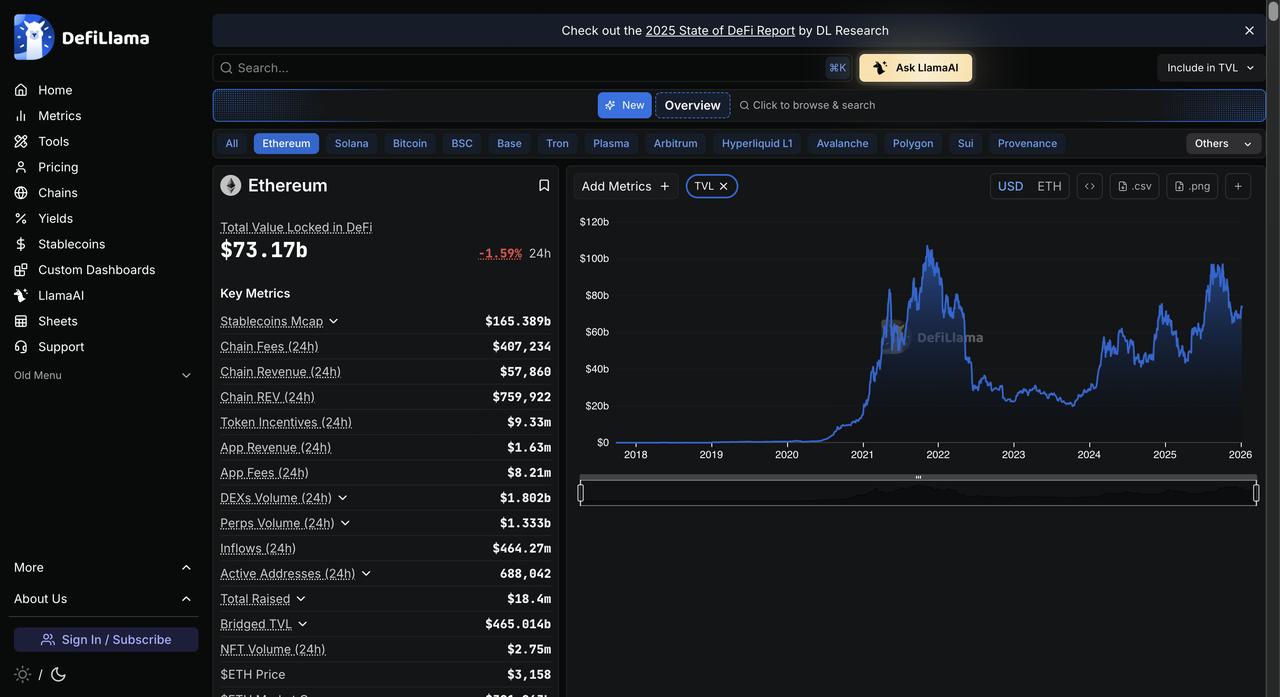
Filter chains by type (EVM/Cosmos) or compare TVL/fees/revenue across multiple networks.
Step 4: Discover Yields and Opportunities
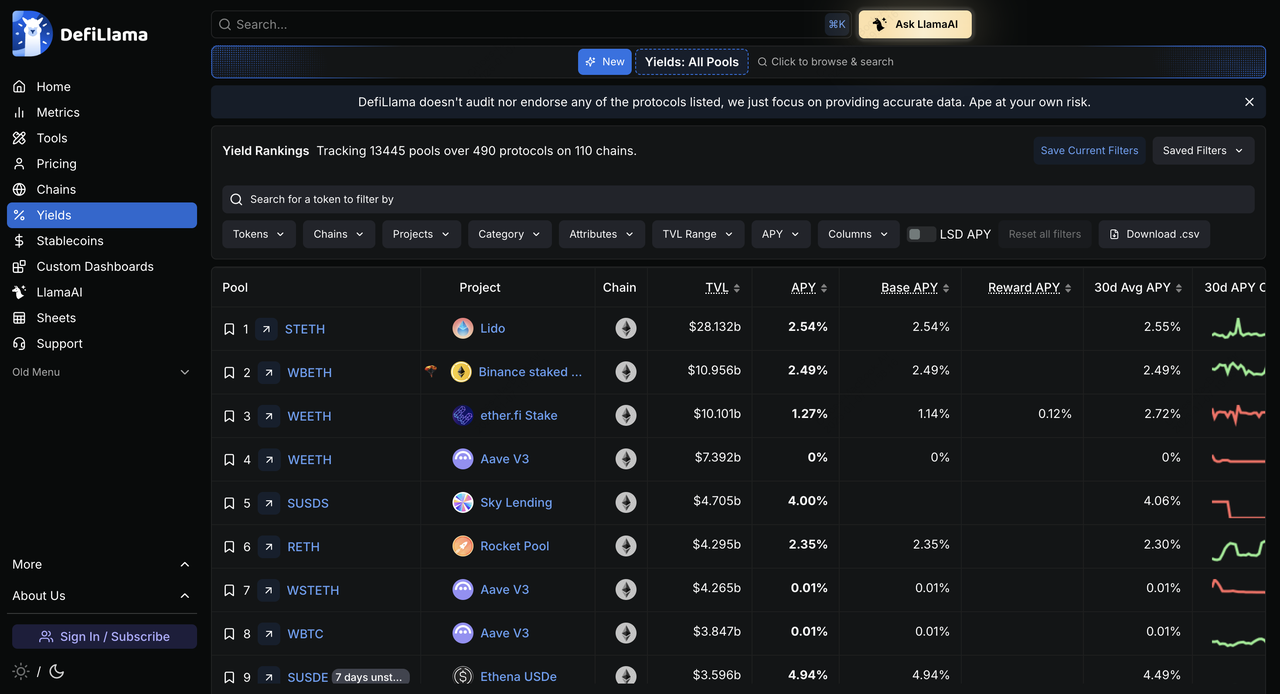
Sort pools by APY/outlook/TVL, view treemaps for market share, and identify farming strategies.
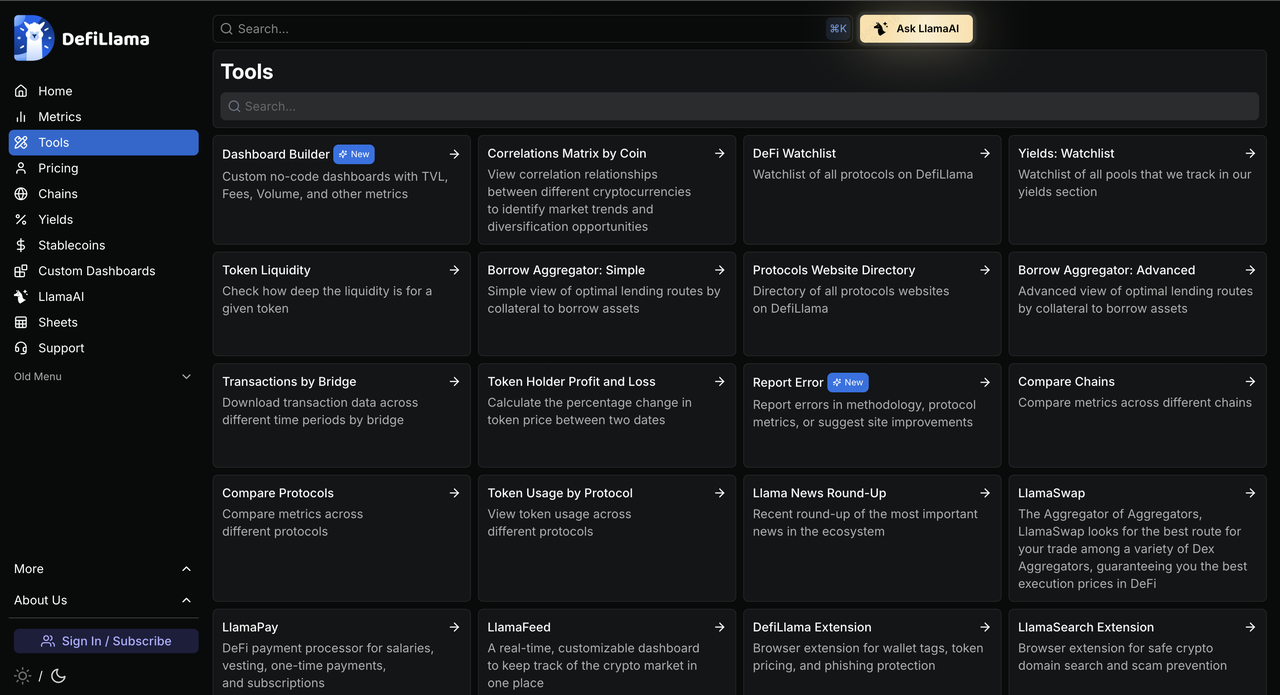
Step 5: Analyze Additional Tools
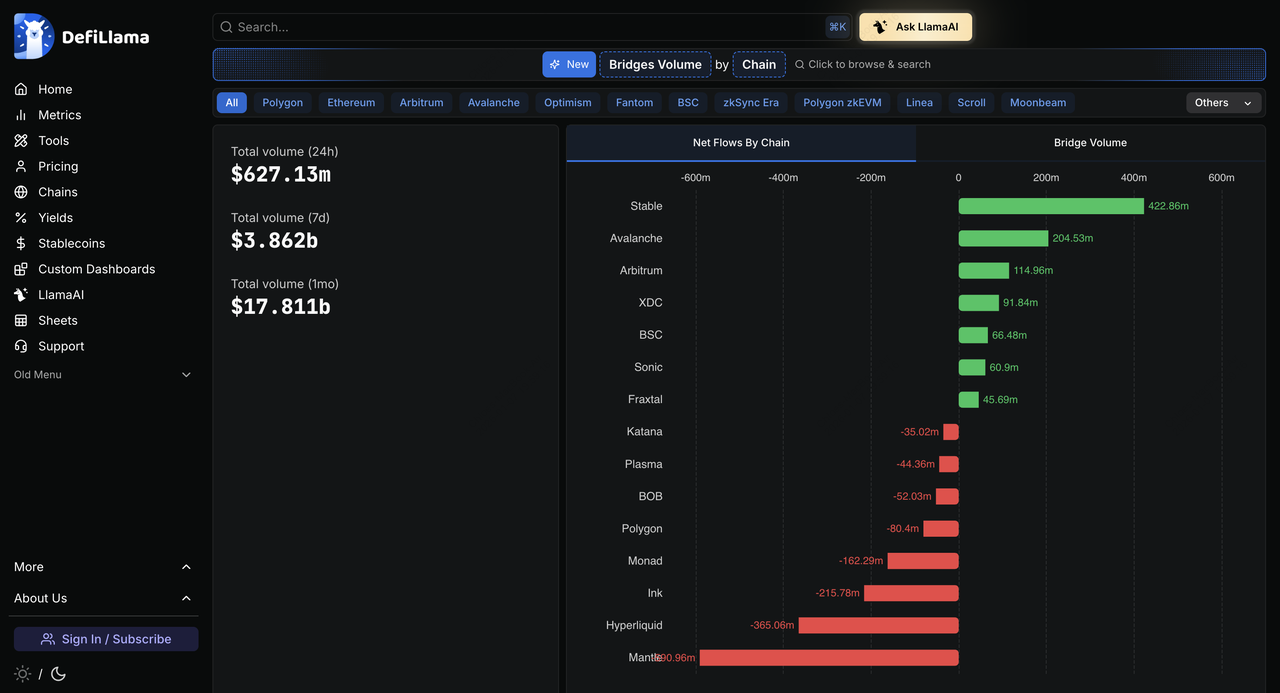
Explore Treasuries, Oracles, Raises, Hacks, Bridges, NFTs, and more for comprehensive insights.
Step 6: Automate Your Strategy (Optional)
Build a simple dashboard in DefiLlama to track metrics you care about, ex., TVL, chain growth, inflows, supply changes. Use APIs from Nansen, Messari, CryptoQuant, Santiment, or CoinGlass to trigger alerts for whale trades, funding spikes, unlock events, or volatility signals.
Combine these signals with BingX AI inside your BingX account to get real-time trade insights, risk alerts, and automated pattern detection that help refine your final trade decisions. You can then execute and manage trades on BingX, using this on-chain and market data as a decision layer, and not as a guarantee.
Conclusion
DefiLlama remains the gold standard for DeFi and blockchain analytics in 2026, offering unparalleled transparency, depth, and community trust in tracking an over $150 billion ecosystem amid rapid innovation and multi-chain growth. From TVL rankings to yield hunting, funding overviews, and hack histories, its free, unbiased tools empower informed decisions for traders, developers, and researchers alike. Visit DefiLlama to explore and stay ahead in decentralized finance.
