Join the Trading Community: Learn & Earn with BingX.
Source: TradingView & BingX
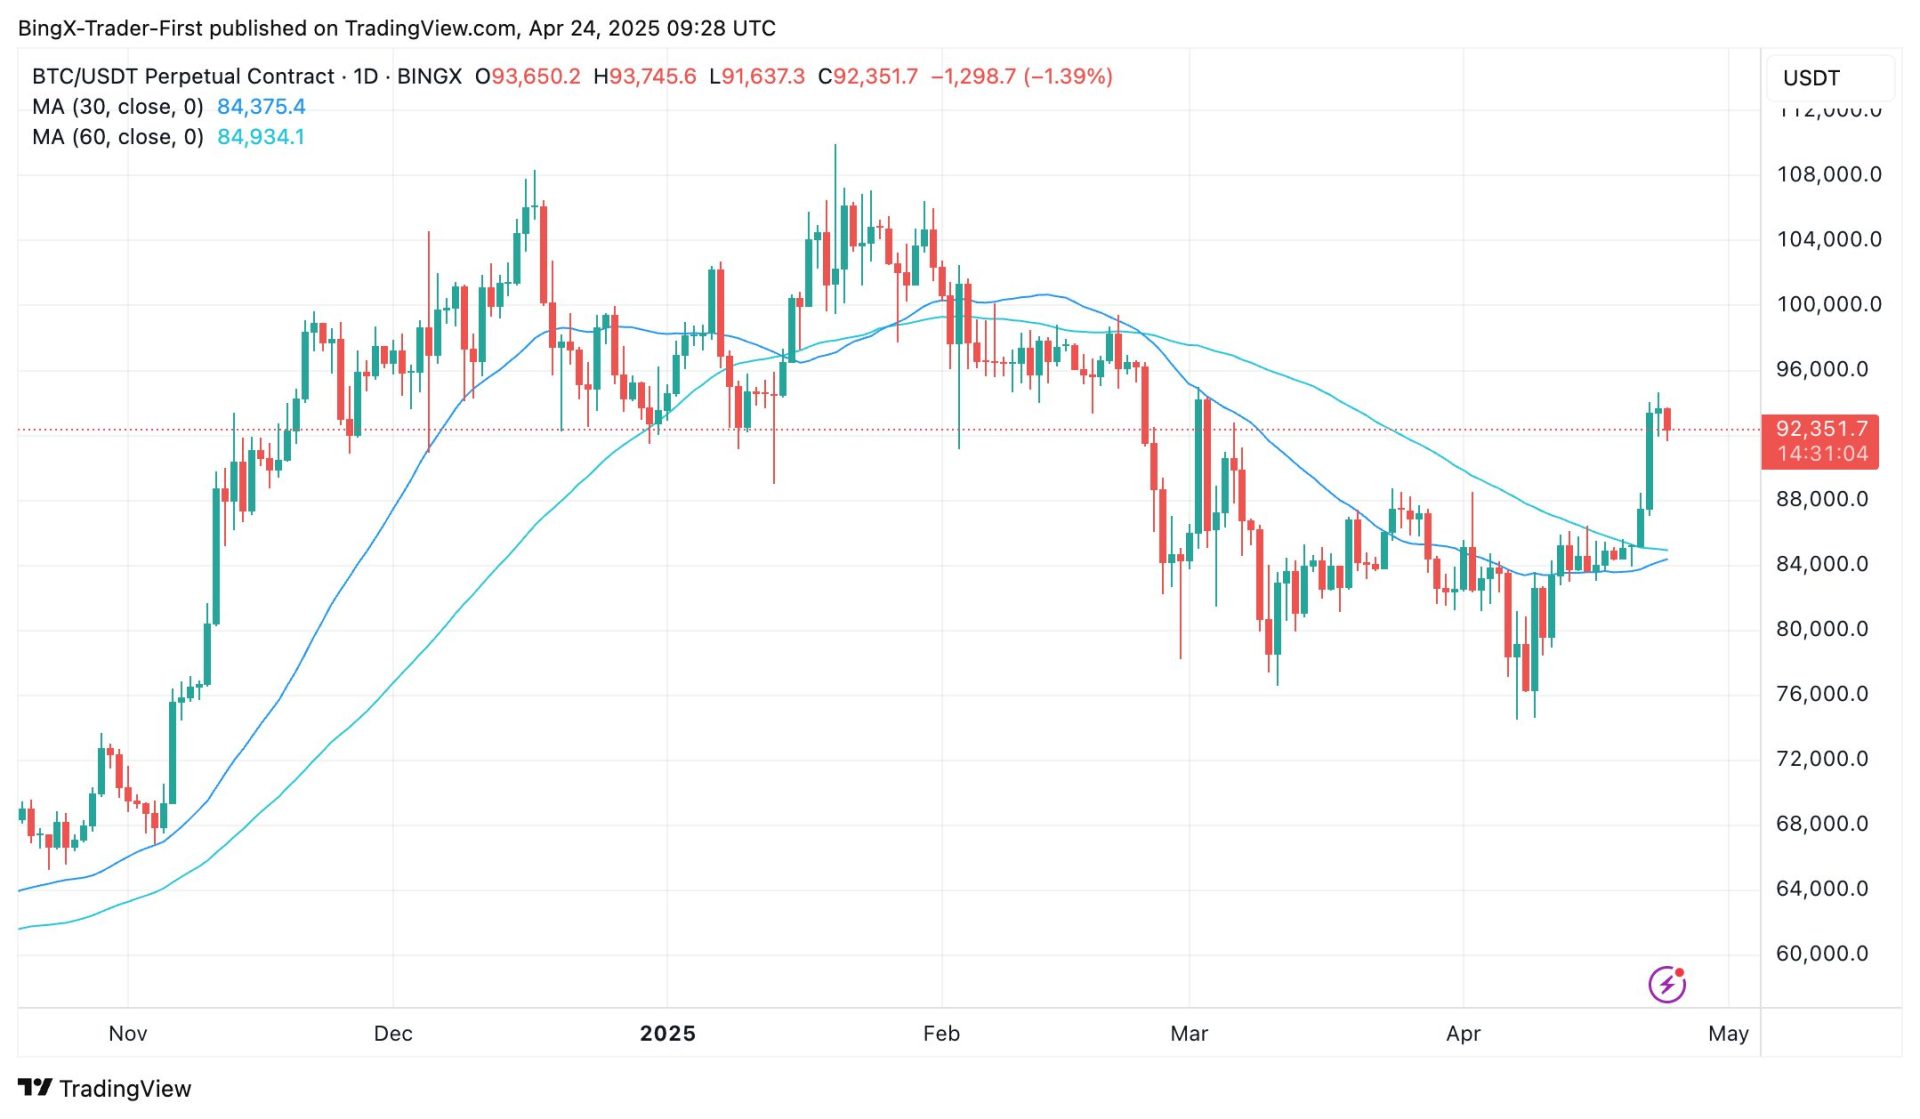
The 4-hour chart of BTC/USDT on April 24, 2025, shows Bitcoin experiencing a decline over the past day. Starting at $92,304.34 on April 23, the price has dropped to a real-time value of $92,346, marking a 0.97% decrease within the last 24 hours. This pullback follows a strong rally from $83,949.42 earlier in the week, with the price peaking at $94,696.05 before the recent downturn. On a 1-day perspective, this decline indicates a short-term correction within a broader bullish trend, as Bitcoin remains above the 200-day moving average of $87,041.11, suggesting the overall uptrend is still intact despite the recent dip.
Technical indicators on the 4-hour chart reflect the bearish momentum. The MACD (12,26,9) shows a value of 185.73, a DEA of 190.79, and a histogram at -154.00, indicating a bearish crossover and increasing selling pressure. The RSI (14) at 53.81 has retreated from overbought levels, now in neutral territory, while the KDJ (K: 84.61, D: 53.81) suggests a potential for further downside as momentum weakens. Volume spiked to 1,432.80K during the peak at $94,696.05, but has since dropped to 14.23K, reflecting reduced trading activity as the price corrects. On the 1-day chart, the price’s position above the 200-day moving average at $87,041.11 supports the bullish trend, but the recent pullback below $93,000 signals a pause in the upward momentum.
Looking ahead, Bitcoin’s short-term outlook is cautiously bullish with risks of further correction. On the 4-hour chart, the current price of $92,346 is testing support around $92,000, and a break below this level could lead to a retest of $90,000 or even $88,000. However, a recovery above $93,000 could push the price back toward $94,696.05. On the 1-day chart, the broader trend remains bullish as long as the price holds above $90,000, but a drop below this level might see a deeper correction toward $87,041.11. Traders should watch for $91,000 as a key support and $93,000 as immediate resistance in the near term.
Disclaimer: BingX does not endorse and is not responsible for or liable for any content, accuracy, quality, advertising, products, or other materials on this page. Readers should do their own research before taking any actions related to the company. BingX is not responsible, directly or indirectly, for any damage or loss caused or alleged to be caused by or in connection with the use of or reliance on any content, goods, or services mentioned in the article.