Join the Trading Community: Learn & Earn with BingX.
Source: TradingView & BingX
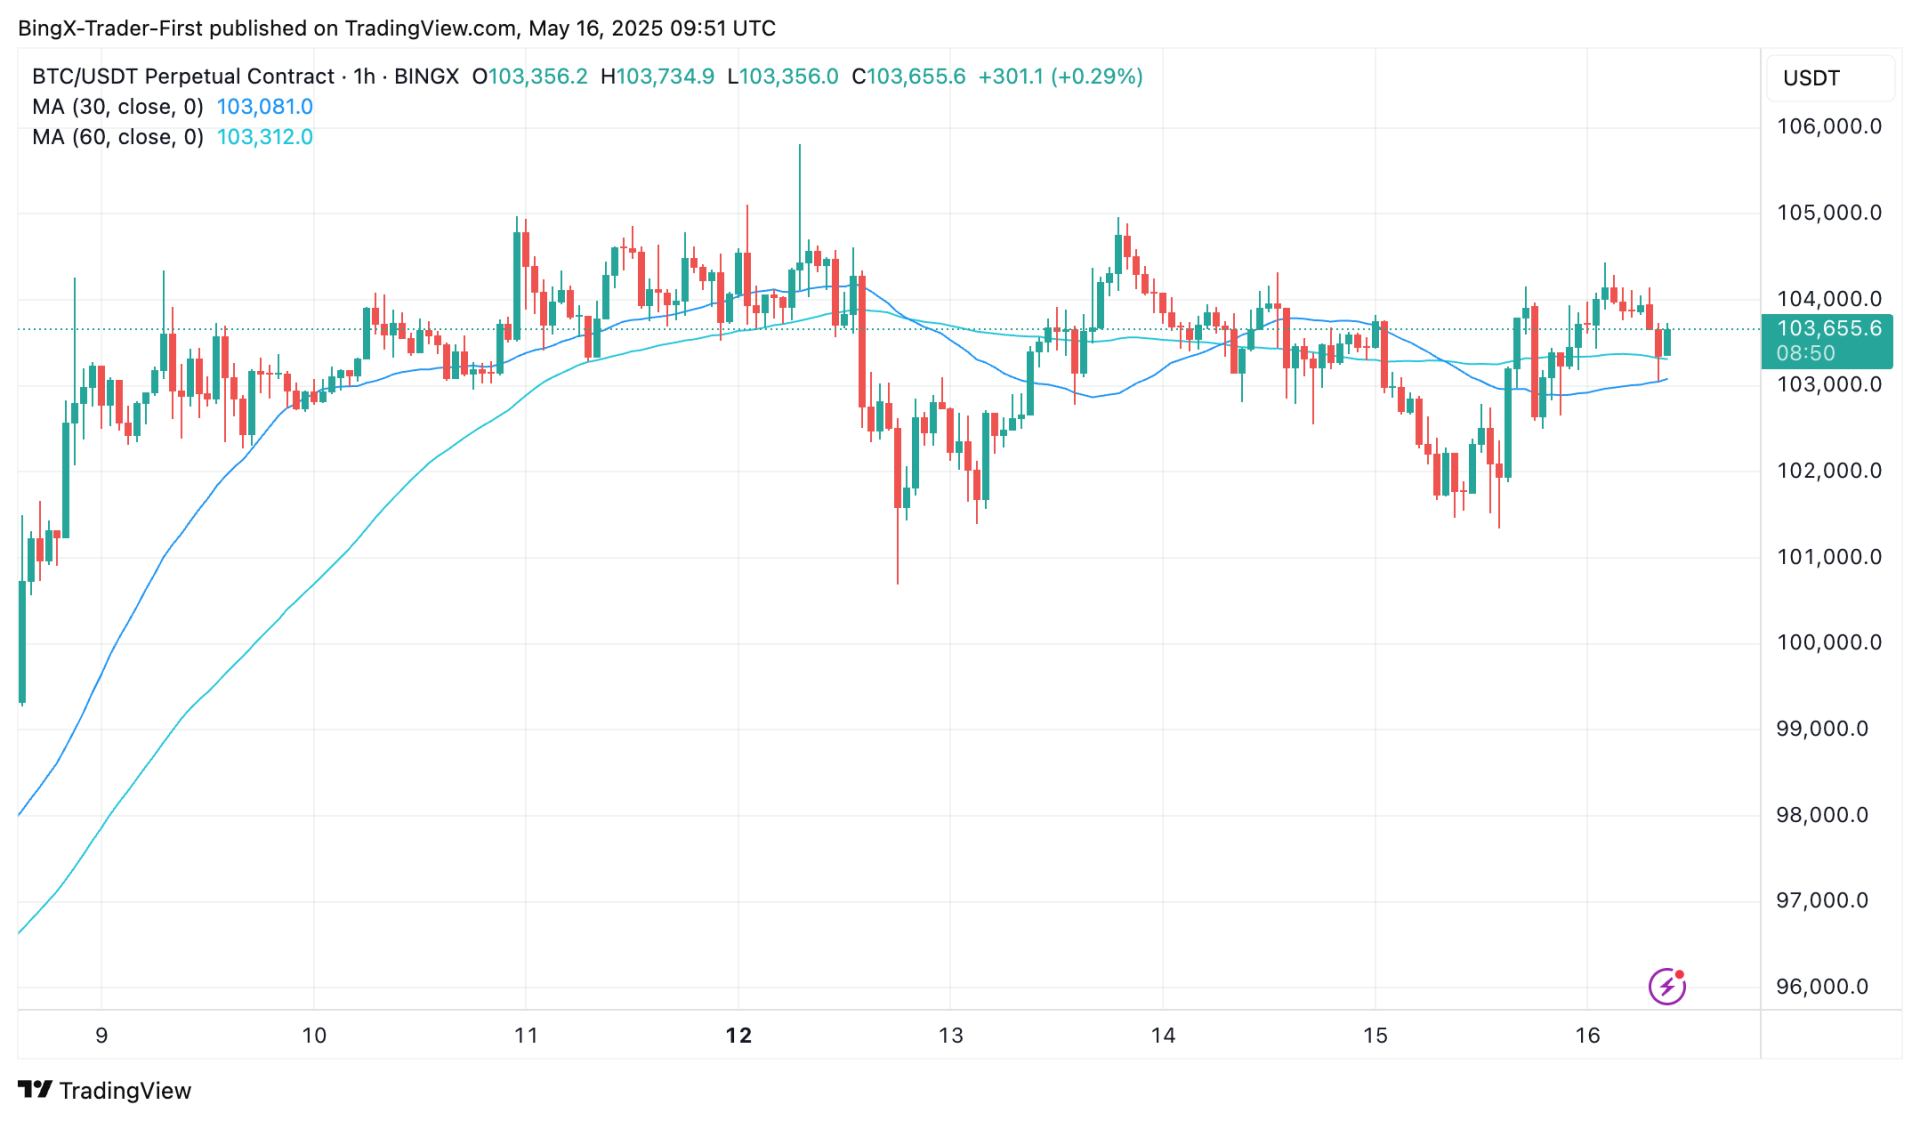
The 4-hour chart shows Bitcoin at $103,665, up 1.58% from recent levels after climbing from a low of $101,500 earlier in the period. The price has broken above the resistance at $102,169 and is approaching the previous high of $104,129, supported by the 30-period moving average at $92,789.6 and the 60-period moving average at $87,789.9. The candlestick patterns indicate renewed buying pressure, with a series of bullish candles driving the move, backed by a moderate increase in volume. The RSI on the 4-hour chart is at 68.23, nearing overbought territory, while the MACD shows a bullish crossover, supporting the upward momentum in the short term.
On the 1-day chart, Bitcoin’s broader trend remains strongly bullish, with the price rising from $58,846 in late 2024 to the current $103,665, maintaining its position above the $100,000 mark. The daily chart shows the price trading near the upper boundary of a long-term ascending channel, with $102,169 now acting as support after the recent move. The 200-period moving average at $93,123.45 continues to trend upward, reinforcing the bullish outlook, and the rally has been accompanied by steady volume, reflecting sustained buyer interest. The RSI on the daily chart is at 76.89, indicating overbought conditions, while the MACD remains bullish but shows slight divergence, suggesting potential weakening momentum.
From a technical perspective, Bitcoin’s current levels on both timeframes highlight a strong uptrend with some cautionary signals. On the 4-hour chart, the bullish MACD and rising RSI suggest the price may test $104,129 again, but the near-overbought RSI indicates a risk of a pullback to $102,169 if momentum fades. On the 1-day chart, the overbought RSI and MACD divergence warn of a possible correction, with support at $102,169 or the 200-period moving average at $93,123. A sustained move above $104,129 could target $105,000, while a drop below $102,169 might lead to a deeper pullback.
Disclaimer: BingX does not endorse and is not responsible for or liable for any content, accuracy, quality, advertising, products, or other materials on this page. Readers should do their own research before taking any actions related to the company. BingX is not responsible, directly or indirectly, for any damage or loss caused or alleged to be caused by or in connection with the use of or reliance on any content, goods, or services mentioned in the article.