Join the Trading Community: Learn & Earn with BingX.
Source: TradingView & BingX
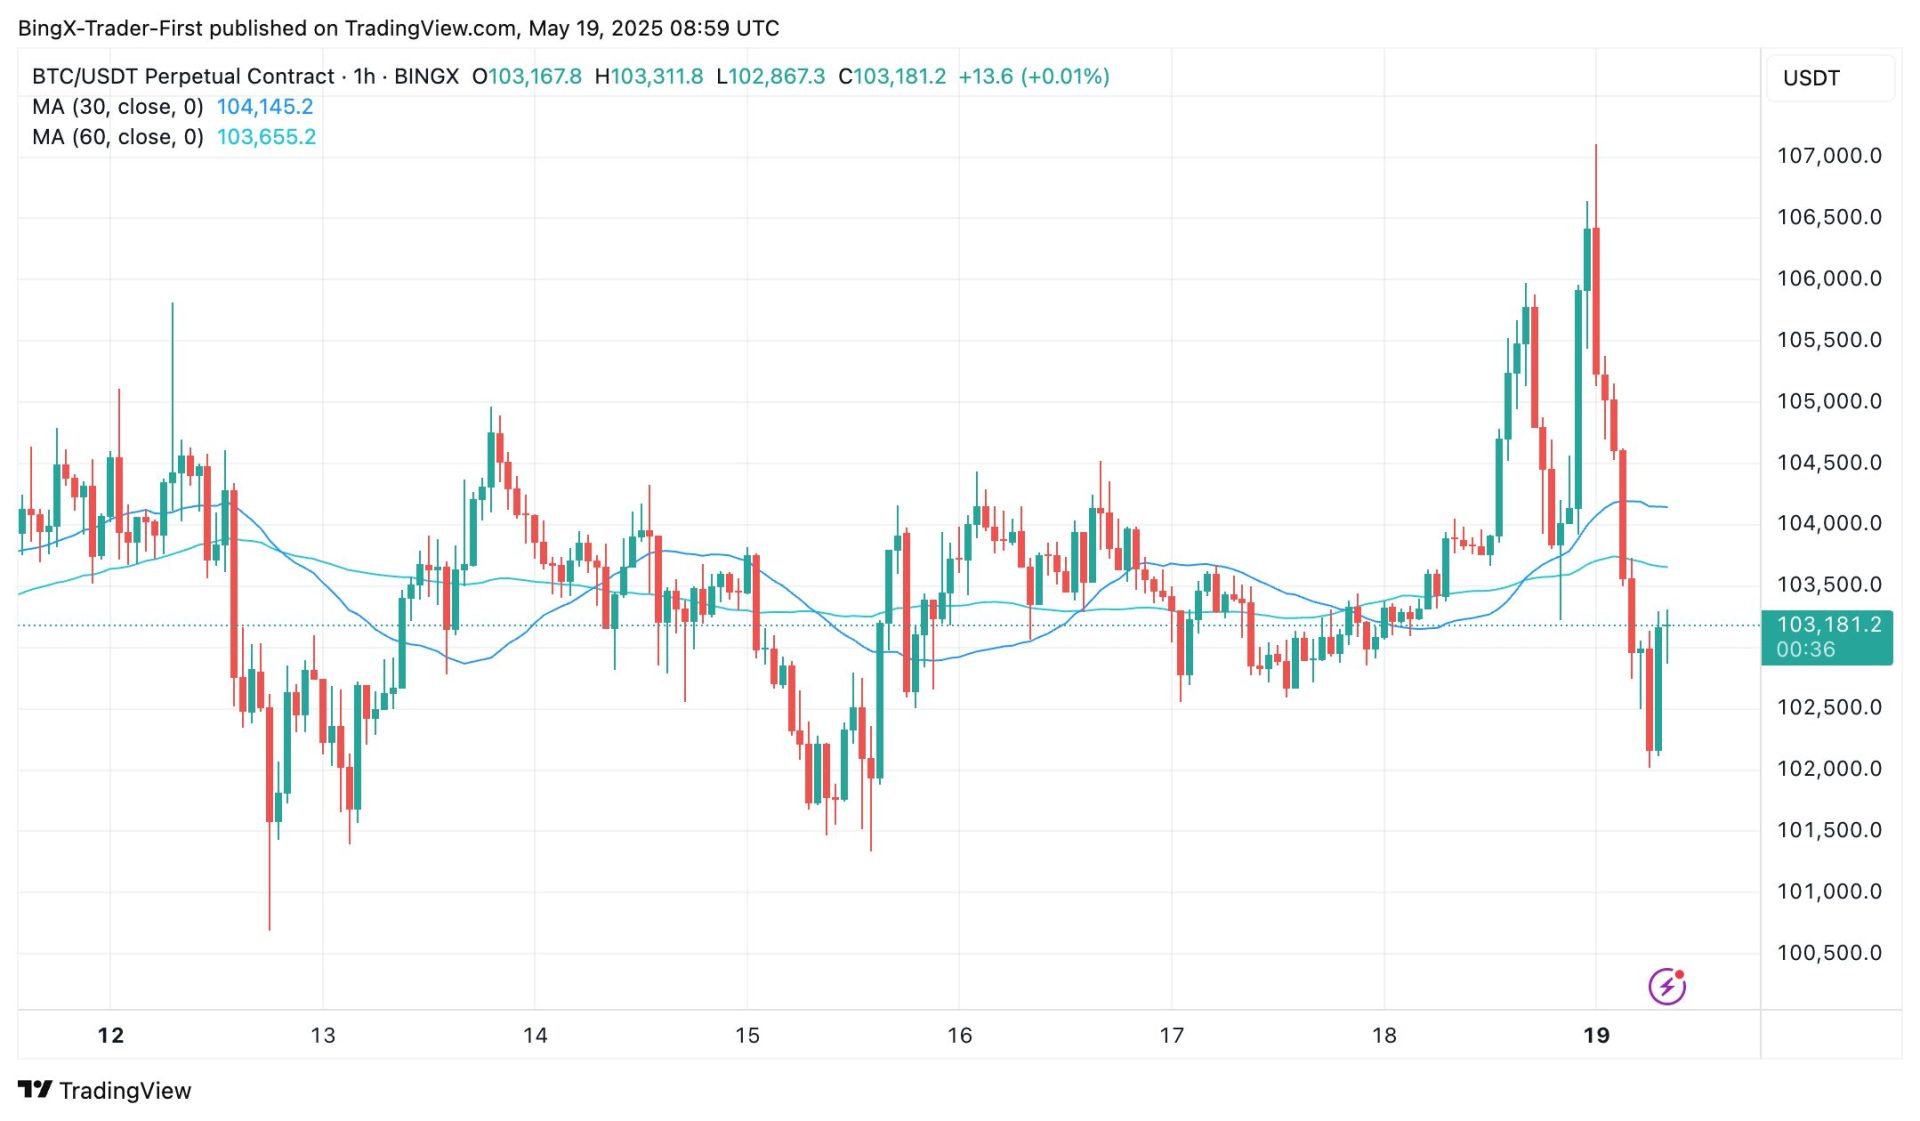
The 4-hour chart shows Bitcoin at $103,133, down 0.51% from the recent level of $103,665 on May 16, after failing to break the resistance at $104,129. The price is currently testing support near $102,169, with the 30-period moving average at $93,456.2 and the 60-period moving average at $88,234.5 providing additional support below. The candlestick patterns show a mix of bullish and bearish action, with a recent bearish candle indicating profit-taking, accompanied by a slight decrease in volume. The RSI on the 4-hour chart is at 65.78, cooling from near-overbought levels, while the MACD remains bullish but with narrowing lines, suggesting a potential slowdown in upward momentum.
On the 1-day chart, Bitcoin’s broader trend continues to be bullish, with the price having rallied from $58,846 in late 2024 to the current $103,133, holding above the $100,000 milestone. The daily chart shows the price consolidating near the upper boundary of a long-term ascending channel, with $102,169 acting as immediate support. The 200-period moving average at $93,789.12 trends upward, supporting the bullish structure, though the recent consolidation has seen a decline in volume, indicating reduced buying pressure. The RSI on the daily chart is at 74.32, still in overbought territory but cooling, while the MACD remains bullish with slight divergence, hinting at a possible weakening of momentum.
From a technical perspective, Bitcoin’s current levels on both timeframes suggest a consolidation phase after the recent rally. On the 4-hour chart, the cooling RSI and narrowing MACD indicate the price may continue to hover between $102,169 and $104,129 in the short term, with a break below $102,169 potentially targeting $98,000. On the 1-day chart, the overbought RSI and channel resistance suggest a risk of a deeper pullback if selling increases, with support at $102,169 or the 200-period moving average at $93,789. A move above $104,129 could reignite bullish momentum toward $105,000, while a sustained drop below $102,169 might signal a correction.
Disclaimer: BingX does not endorse and is not responsible for or liable for any content, accuracy, quality, advertising, products, or other materials on this page. Readers should do their own research before taking any actions related to the company. BingX is not responsible, directly or indirectly, for any damage or loss caused or alleged to be caused by or in connection with the use of or reliance on any content, goods, or services mentioned in the article.