
The Stochastic Relative Strength Index (StochRSI) is a fast-reacting momentum indicator that applies the stochastic formula to RSI values, giving traders a sharper view of momentum shifts. Unlike the standard RSI, which tracks price momentum directly, StochRSI measures how the RSI itself moves within its recent range.
In the fast-paced world of crypto trading, this added sensitivity helps identify overbought or oversold conditions before they’re visible on other indicators. Whether you're trading short-term or fine-tuning your trend entries, mastering StochRSI can improve your timing and confidence.
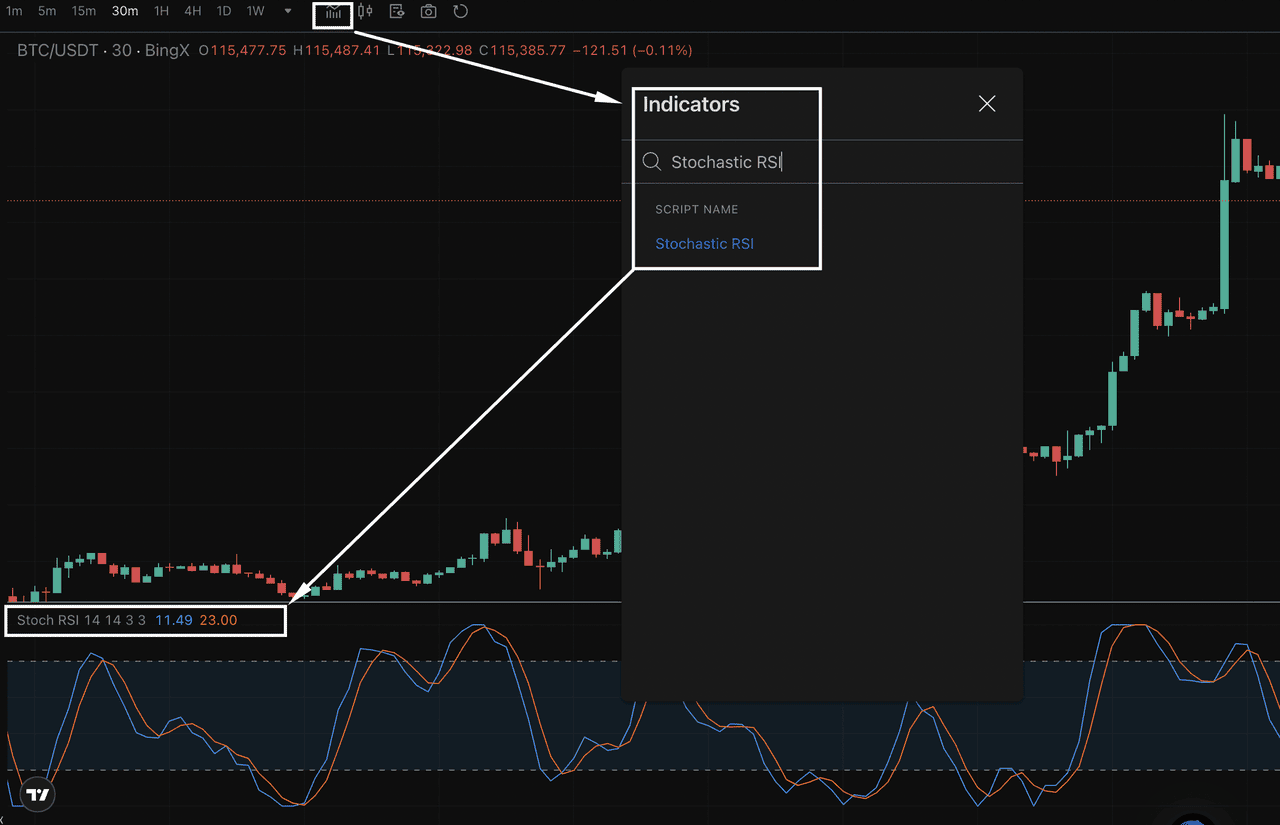
On BingX, traders can access the Stochastic RSI directly within the TradingView-powered charts, allowing for seamless integration with other tools.
What Is the Stochastic RSI (StochRSI) Indicator?
The Stochastic RSI is a momentum indicator built on top of another popular indicator, the Relative Strength Index (RSI). Rather than analyzing price data directly, it measures the RSI’s own movement over a set period, providing a second layer of insight into market momentum.
This approach helps identify overbought or oversold conditions more sensitively than the standard RSI.
Source: BTC/USDT Trading Chart on BingX
In simple terms, it tracks where the current RSI value stands relative to its recent high and low. This can offer faster signals, especially useful in volatile crypto markets where timely decision-making is critical.
The formula is:
Stochastic RSI = (Current RSI – Lowest RSI) / (Highest RSI – Lowest RSI) Calculated over a specific lookback period (commonly 14 periods)
Key inputs include:
• RSI length – the period used to calculate the base RSI (often 14)
• Stochastic length – the number of RSI values considered in the formula (also typically 14)
Developed by Tushar Chande and Stanley Kroll, the Stochastic RSI is widely used by technical traders looking for early signals of trend continuation or potential reversals in cryptocurrency trading.
How Stochastic Relative Strength Index (Stochastic RSI) Works
The Stochastic Relative Strength Index (Stochastic RSI) operates on a scale from 0 to 1 (or 0 to 100, depending on the platform) and helps traders identify momentum shifts. Readings above 0.80 typically indicate overbought conditions, while values below 0.20 suggest the asset may be oversold, important cues for timing entries or exits.
Source: BTC/USDT Trading Chart on BingX
What makes this indicator unique is its use of two lines:
• %K Line (Fast Line): This is the raw Stochastic RSI value.
• %D Line (Slow Line): A simple moving average of the %K line, often over a three-period span.
Traders watch for crossovers between these two lines. For example:
• When the %K crosses above the %D from below 0.20, it may signal a bullish reversal.
• When the %K crosses below the %D from above 0.80, it may indicate that bearish momentum is building.
These crossovers often appear before signals from traditional indicators like the Relative Strength Index (RSI) or Moving Average Convergence Divergence (MACD). That makes the Stochastic RSI indicator especially useful for crypto traders seeking early signs of potential trend reversals or breakouts.
Because crypto markets are fast-moving, having this leading indicator in your toolkit can make all the difference in capturing strong moves with tighter entries.
How to Read and Interpret Stochastic RSI
The Stochastic Relative Strength Index (StochRSI) is a momentum indicator that applies the stochastic formula to Relative Strength Index (RSI) values, making it more responsive to short-term shifts. It ranges between 0 and 1 (or 0 to 100 depending on your charting tool) and is used to identify overbought and oversold conditions with greater speed than traditional RSI.
Spotting Overbought and Oversold Conditions
• Overbought: A reading above 0.80 suggests the asset may be stretched and a pullback could follow.
• Oversold: A reading below 0.20 signals the asset might be undervalued, hinting at a potential rebound.
Crossover Signals
• Bullish Crossover: When the %K line crosses above the %D line below 0.20, it may indicate a shift toward bullish momentum.
• Bearish Crossover: When %K crosses below %D above 0.80, it suggests weakening strength and a possible reversal to the downside.
Source: BTC/USDT Trading Chart on BingX
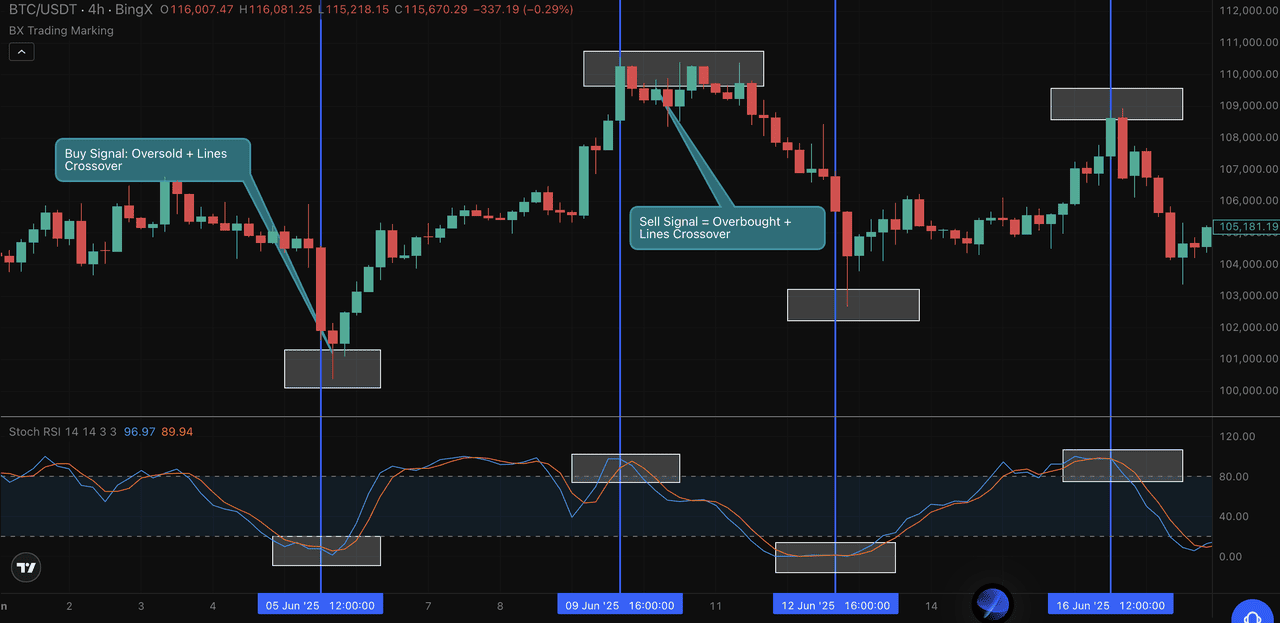
Stochastic RSI Chart Example: Overbought and Oversold Signals
In this BTC/USDT 4-hour chart from BingX, the Stochastic Relative Strength Index (Stochastic RSI) clearly highlighted two key moments:
• Oversold Buy Signal: On June 5, %K crossed above %D below the 20 level. Bitcoin traded near $104,600, followed by a sharp rally.
• Overbought Sell Signal: On June 9, %K crossed below %D above the 80 level. Price was near $112,000 before a pullback.
These overbought and oversold crossovers show how Stochastic RSI can help traders spot trend shifts early—especially in volatile crypto markets.
How to Avoid False Signals (Whipsaws)
Because it’s so sensitive, StochRSI can trigger frequent signals. To reduce noise:
• Use price confirmation (e.g., candle breaks or volume surges).
• Combine with trend-following tools like moving averages or RSI for added context.
Combining StochRSI with trend structure helps filter out weak setups and focus on signals that align with momentum.
Stochastic RSI vs. Relative Strength Index (RSI) vs. Stochastic Oscillator
These three technical indicators often get mixed up, but they serve distinct roles in crypto trading. Understanding the differences helps traders choose the right tool for their strategy.
• Relative Strength Index (RSI): Measures price momentum. It looks at recent gains and losses to determine if an asset is gaining or losing strength. A reading above 70 is considered overbought, while below 30 is oversold.
• Stochastic Oscillator: Compares the current price to its high-low range over a period. It’s great for identifying if price is trading near the top or bottom of that range, ideal for sideways or ranging markets.
• Stochastic RSI: Applies the stochastic oscillator formula to RSI values instead of price. This makes it a more sensitive indicator, better suited for capturing quick shifts in momentum, especially in volatile markets like cryptocurrency.
Source: BTC/USDT Trading Chart on BingX
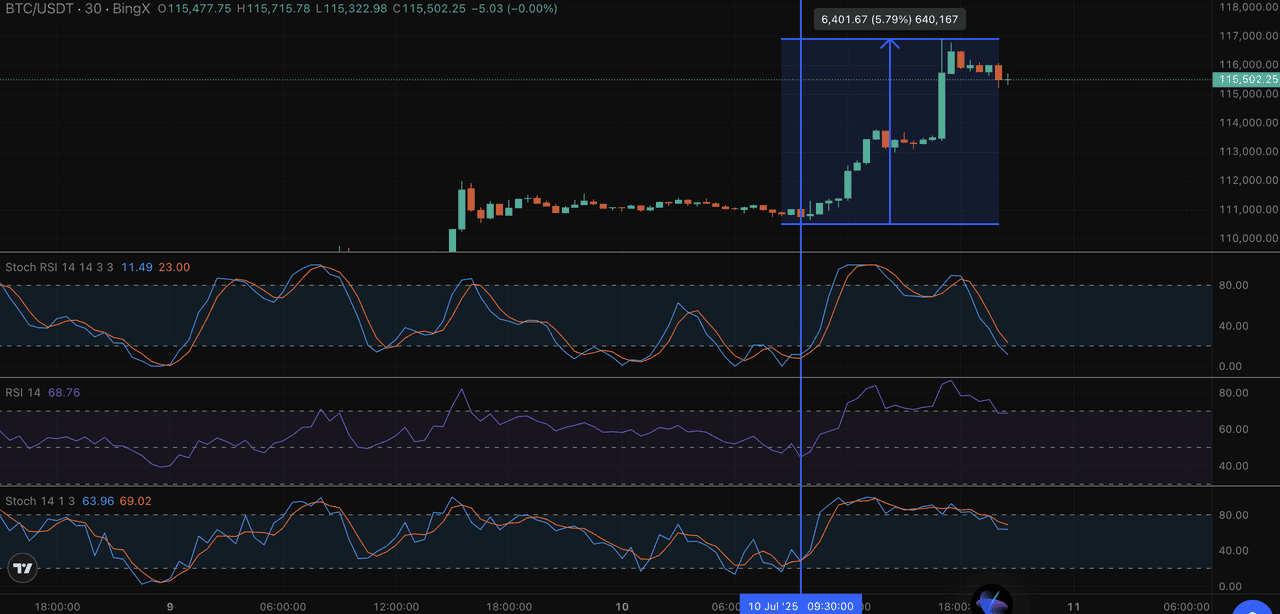
In a 30-minute BTC/USDT chart on BingX, Stochastic RSI gave a bullish crossover from oversold territory before price broke out.
At that point:
• RSI was still below 70 and hadn't confirmed a signal
• The Stochastic Oscillator was unclear due to price noise
When to Use RSI, Stochastic RSI, and Stochastic Oscillator
1. Use RSI for smoother, more reliable signals in trending markets.
2. Use the Stochastic Oscillator for quick, frequent signals in ranging or choppy markets.
3. Use the Stochastic RSI when you need heightened sensitivity to momentum shifts, especially in fast-paced environments such as cryptocurrency trading.
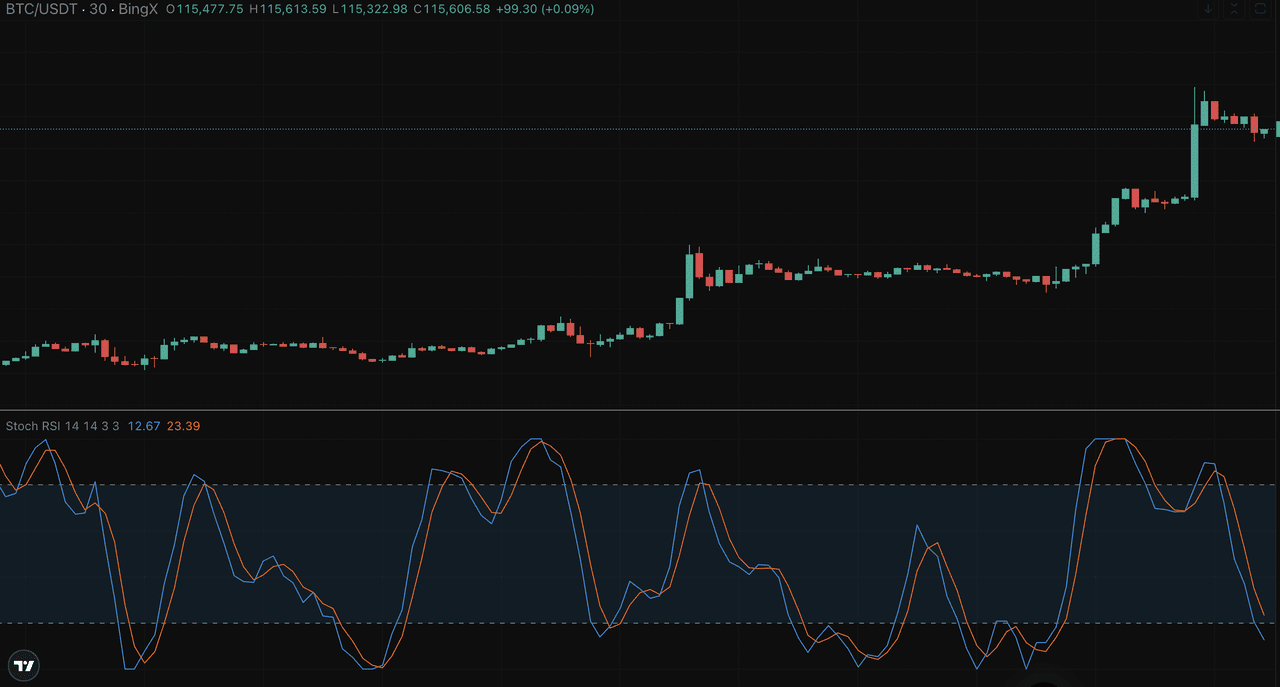
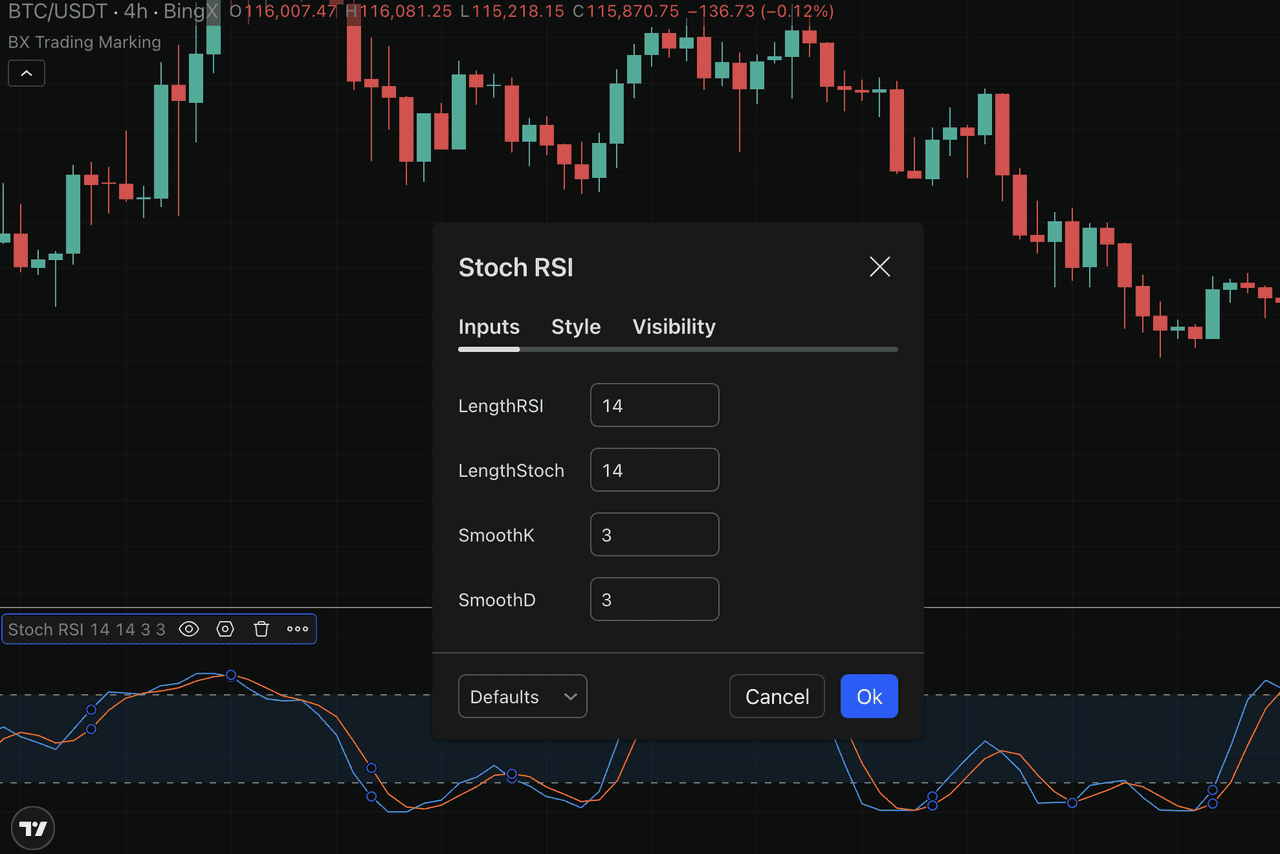
What Are the Best Settings and Lookback Periods for Stochastic RSI?
The default Stochastic RSI settings are typically RSI(14) with Stoch(14, 3, 3), where 14 is the lookback period for RSI, and 3, 3 are smoothing parameters for %K and %D lines. These settings balance sensitivity and noise for general use.
Source: BTC/USDT Trading Chart on BingX
For high-volatility coins or fast markets, traders often customize settings by shortening the lookback period (e.g., Stoch length 5) to generate quicker signals. This increases responsiveness but also noise, leading to more false signals.
Conversely, longer settings (e.g., Stoch length 21, %K and %D at 14) produce smoother, slower signals that filter out noise but may delay entries and exits.
In summary:
• Shorter settings = more signals but more noise (good for day trading or volatile assets).
• Longer settings = smoother, slower signals (better for swing or position trading).
Always adjust settings based on your trading style and the asset’s volatility for optimal results.
Top Trading Strategies Using Stochastic RSI
Stochastic RSI is a versatile momentum oscillator that excels in both trend continuation and reversal strategies, especially when combined with other tools for confirmation.
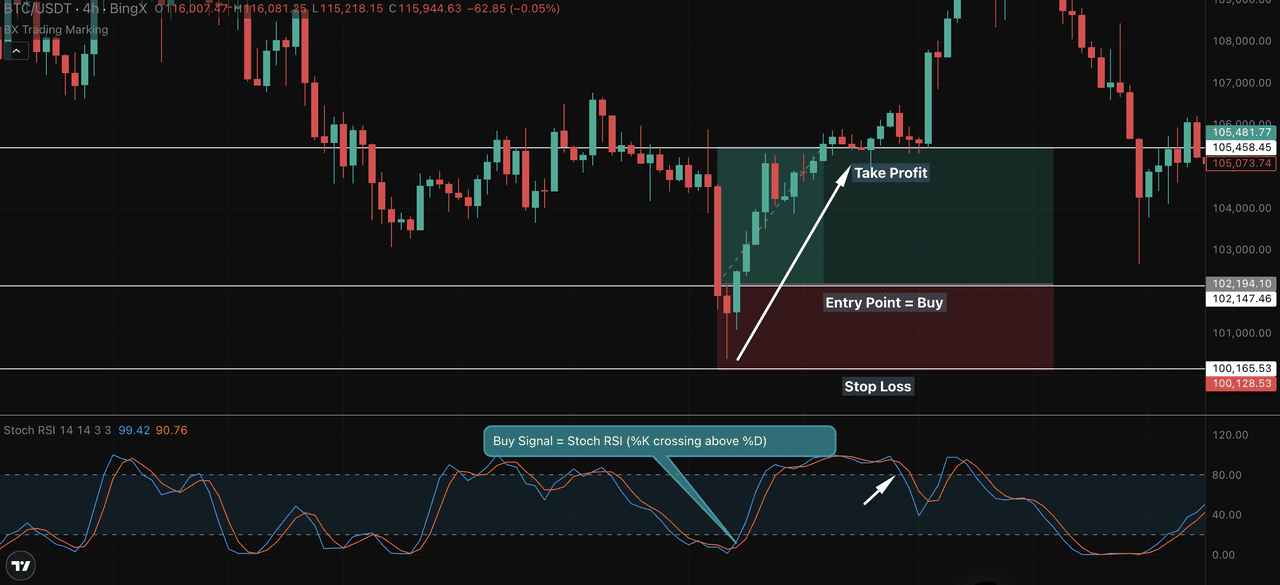
1. Trend Continuation Strategy
One effective way to trade with the Stochastic Relative Strength Index (StochRSI) is to use it in the direction of the prevailing trend. A bullish crossover in the oversold zone can signal that the trend is resuming, often before price fully takes off.
Source: BTC/USDT Trading Chart on BingX
Chart Example – BTC/USDT 4H (BingX) In the chart above, Bitcoin was in a broader uptrend. On the StochRSI (14, 14, 3, 3) setting, the %K line crossed above the %D line, which is below the 0.20 level. This crossover occurred while price was holding near a support zone at $100,128.
A buy entry was triggered around $102,147, with a stop-loss placed slightly below the recent low near $100,128. The price then rallied and hit the take-profit target near $105,458, aligning with prior resistance levels.
This simple continuation trade produced a clean risk-to-reward setup based on:
• Oversold StochRSI + bullish crossover
• Confluence with price holding support
• Strong upward follow-through in price
Pro Tip: For added confirmation, look for price staying above a rising moving average or breaking above a minor resistance level after the crossover. Always use a stop-loss below the swing low to manage risk.
2. Reversal Strategy: Divergence Trading
Divergence between price and the Stochastic Relative Strength Index (StochRSI) can offer powerful early clues of trend reversals.
• Bullish Divergence: When price makes higher lows, but StochRSI makes lower lows, it suggests that momentum is resetting despite an overall uptrend. This often leads to a breakout as buyers regain control.
• Bearish Divergence: If price makes higher highs while StochRSI makes lower highs, it could be a warning that bullish momentum is fading.
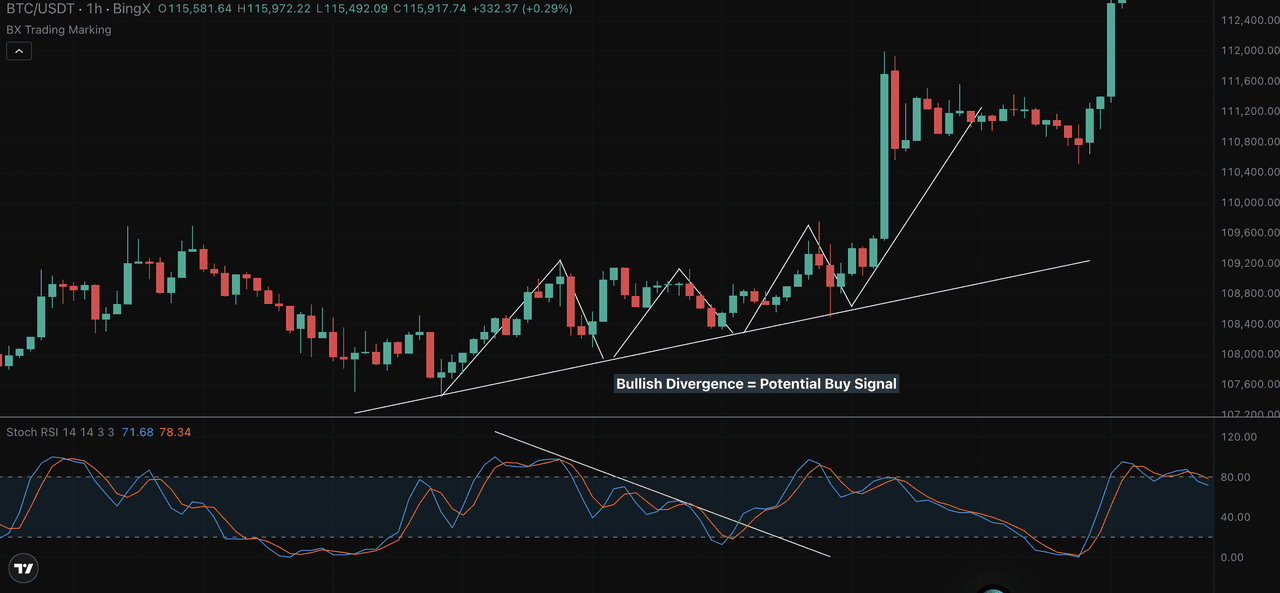
Source: BTC/USDT Trading Chart on BingX
Chart Example – BTC/USDT 1H (BingX) In the chart above, BTC/USDT held a rising trendline while StochRSI showed falling momentum. This bullish divergence signaled momentum was recovering before the breakout past $112,000.
Focus on the %D line for cleaner divergence signals and always confirm with price structure. When price respects a trendline or key level while StochRSI resets, it often sets up for strong moves.
3. Multiple Timeframe Strategy: Align with the Bigger Picture
One of the most effective ways to improve Stochastic RSI signals is by using multiple timeframes.
Start by identifying the primary trend on a higher timeframe like the 4-hour or daily chart. This indicates whether the market is generally trending upward or downward. Then, zoom into a lower timeframe like the 1-hour or 15-minute chart to find precise entry points.
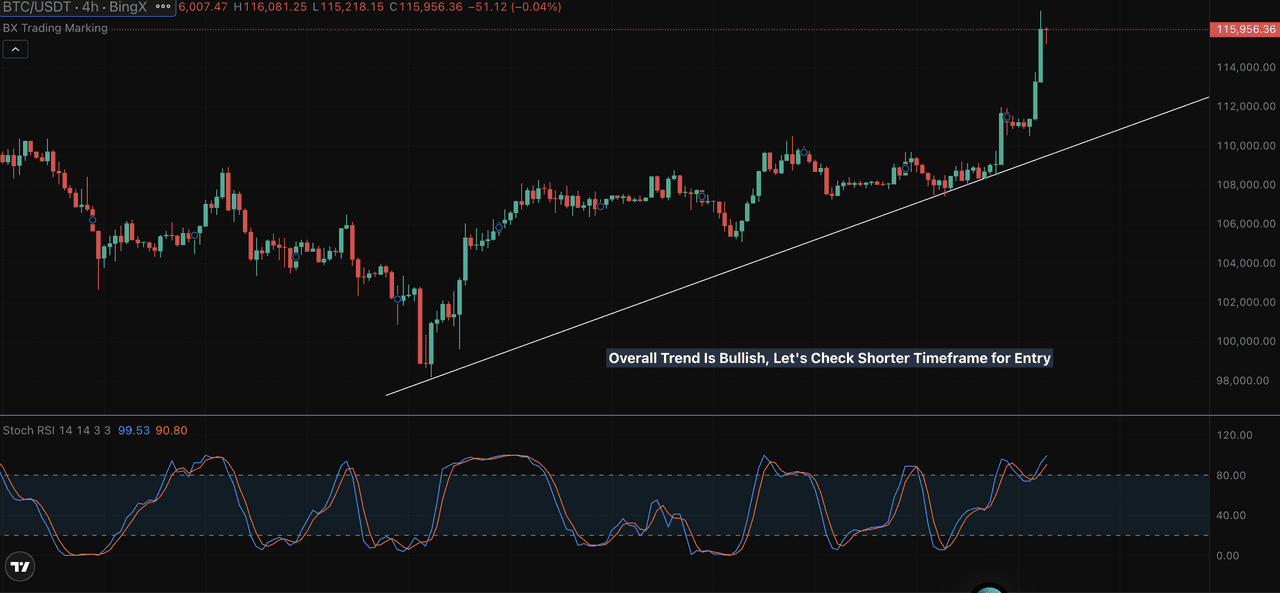
Look for:
• Bullish crossovers (when %K crosses above %D) in oversold zones if the higher timeframe shows an uptrend.
• Bearish crossovers in overbought zones if the higher timeframe is in a downtrend.
• Or use divergence signals for reversals, but only if the setup aligns with the larger trend.

This strategy helps you trade with the trend while entering at more favorable moments. For example, if BTC/USDT is trending upward on the 4H chart and you spot a bullish Stoch RSI crossover on the 1-hour chart near support, it’s a higher-probability trade than trading against the trend.
4. Confluence Strategy: Combine Stochastic RSI with Moving Averages
Using Stochastic RSI alone can give too many signals. That’s why smart traders look for confluence—multiple factors aligning to confirm a trade.
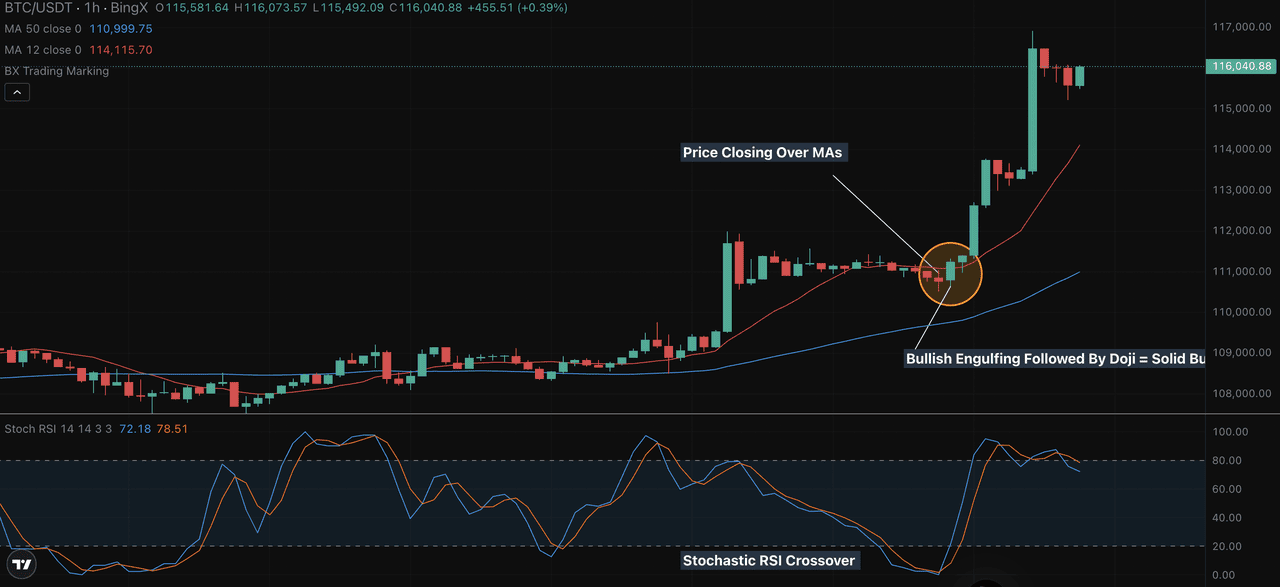
In this BTC/USDT 1-hour chart from BingX:
• Stochastic RSI gave a bullish crossover just after dipping near oversold levels.
• Price action formed a bullish engulfing candle followed by a Doji, signaling buyer strength.
• At the same time, BTC was trading above both the 12 and 50-period moving averages, showing bullish structure.
Result: After this triple confirmation, price surged from around $111,000 to over $116,000.
Tip for Beginners:
• When Stoch RSI crosses up near a support zone or MA (like the 50-MA), it’s a stronger buy signal.
• Always check if price is respecting trend structure or breaking out after consolidation.
This kind of layered approach can help filter out fakeouts and improve entry quality.
How to Combine Stochastic RSI with Other Technical Indicators
To enhance trading accuracy, Stochastic RSI is often combined with complementary indicators:
1. Moving Averages (MA): Provide trend confirmation by showing whether price is above or below key averages, helping to filter trades in the direction of the trend.
2. Volume Indicators (OBV, VWAP): Validate the strength of breakouts or reversals by confirming that volume supports price moves, reducing false signals.
3. MACD: Confirms trend direction and momentum shifts, aligning with Stoch RSI signals for stronger entry or exit points.
4. Price Action: Candlestick patterns like Doji or engulfing candles at support/resistance levels offer visual confirmation of potential reversals or continuations.
Using these tools together helps filter noise, improve signal reliability, and manage risk more effectively in volatile markets.
Common Mistakes to Avoid
1. Trading every crossover: Not all %K and %D crossovers lead to real moves. Avoid acting on every signal without context.
2. Ignoring the trend: A bullish crossover in a downtrend is weaker. Always align trades with the broader trend.
3. No confirmation: Stochastic RSI alone can mislead. Combine it with support/resistance, moving averages, or volume.
4. Single timeframe bias: Using only one timeframe increases risk. Check higher timeframes to confirm direction.
5. Overtrading sideways markets: In choppy conditions, Stoch RSI creates frequent false signals. It's best to wait for clean trends.
Conclusion and Key Takeaways
Stochastic RSI is a powerful momentum tool for spotting reversals and trend shifts. To use it effectively, always confirm with price action, trend direction, and other indicators. Avoid relying on isolated signals, especially in sideways markets. Use multiple timeframes and confluence with support, resistance, or moving averages to increase accuracy. With practice on BingX charts, you’ll refine your setups and develop more confidence in your entries and exits.
Related Articles
4. Simple Moving Average(SMA) vs Exponential Moving Average(EMA) in Crypto Trading: Differences to Know
Frequently Asked Questions (FAQ)
1. What is the difference between Stochastic RSI and RSI?
The Stochastic Relative Strength Index (Stoch RSI) applies the stochastic oscillator formula to RSI values instead of price. This makes it more sensitive and responsive than the traditional Relative Strength Index (RSI), which measures momentum directly from price changes.
2. How to use Stochastic RSI to spot overbought or oversold conditions?
On most platforms like BingX, values above 0.80 indicate overbought conditions, while values below 0.20 signal oversold conditions. Look for %K and %D line crossovers in these zones to identify potential trend reversals.
3. What are the best settings for the Stochastic RSI indicator?
The default and most popular setting is Stoch RSI (14, 14, 3, 3). Traders adjust the lookback period based on asset volatility, shorter periods give faster signals with more noise, while longer settings provide smoother but slower signals.
4. Can I use Stochastic RSI with other technical indicators?
Yes. Many technical traders combine Stochastic RSI with tools like moving averages, MACD, volume indicators (like OBV or VWAP), and support/resistance zones to increase signal accuracy and reduce false entries.
5. Is Stochastic RSI good for all market conditions?
Not always. Stochastic RSI works best in trending markets or during breakout setups. In sideways or choppy conditions, it may produce false signals. That’s why combining it with trend analysis and multi-timeframe strategies is key.
