A liquidity sweep is a sudden price move beyond a key high or low, such as a swing high, equal highs, or a round number, designed to trigger stop-loss orders and pending orders clustered at that level, before sharply reversing in the opposite direction. Rather than a true breakout, the price sweeps through the level, absorbs the available liquidity, and then reverses to continue in its original or intended direction.
Liquidity sweeps are a core concept in Smart Money Concepts (SMC) and ICT trading methodology, and understanding them helps traders avoid being trapped and instead trade alongside institutional order flow. In this guide, you will learn why liquidity sweeps happen, how to identify bullish and bearish sweeps on a Bitcoin chart, the difference between a sweep, a liquidity grab, and a true breakout, how to build a complete trade setup around confirmed sweeps, and how to apply this on BingX Spot and Perpetual Futures.
What Is a Liquidity Sweep in Crypto Trading and How Does It Happen?
To understand a liquidity sweep, you first need to understand the problem large institutional traders face when entering the market.
When a retail trader wants to buy $5,000 of Bitcoin, the order fills instantly with no impact on price. But when a hedge fund or market maker wants to buy $500 million of Bitcoin, they face a very different challenge. If they place one large buy order, they will move the price dramatically against themselves before the order is even filled.
To solve this, large players need a flood of counter-party orders, people willing to sell to them at the same price range, in large quantities. Where do those sellers come from? They come from stop-loss orders.
When retail traders place stop-losses below swing lows, those orders sit waiting in the market as unfilled sell orders. When price dips below the swing low and triggers those stops, it creates a sudden surge of sell orders, exactly the liquidity large buyers need to fill their position without slippage. After absorbing that liquidity, institutions have what they need and push prices back upward.
This is the liquidity sweep. It is not random volatility. It is a calculated price move to fill institutional orders using retail stop-losses as the fuel.
Liquidity Clusters: Where Does Liquidity Accumulate?
Liquidity clusters at predictable locations, places where large numbers of retail traders tend to place their stop-losses and pending orders:
|
Location |
Why liquidity clusters here |
|
Swing highs |
Short sellers place stop-losses above recent highs |
|
Swing lows |
Long holders place stop-losses below recent lows |
|
Equal highs |
Multiple tests at the same level = concentrated stops |
|
Equal lows |
Multiple tests at the same level = concentrated stops |
|
Round numbers (e.g. $80,000, $100,000) |
Psychological levels attract stop clusters |
|
Previous day / week high and low |
Widely watched levels by day traders |
|
Tight consolidation zones |
Order accumulation before a move |
Buy-Side Liquidity vs. Sell-Side Liquidity: Key Differences
In Smart Money Concepts, liquidity is categorised into two types depending on where it sits relative to price:
Buy-Side Liquidity (BSL)
Buy-side liquidity sits above recent highs. It consists of:
- Stop-losses from short sellers (who stop out when price breaks above the high)
- Buy stop orders from breakout traders (who enter long when price breaks above resistance)
When institutions need to sell large positions, they target BSL, they push price above the high to trigger all those buy orders, use that buying as the counter-party for their selling, then drive the price back down.
BSL sweep = bearish signal: price spikes above highs, absorbs buy orders, then reverses downward.
Sell-Side Liquidity (SSL)
Sell-side liquidity sits below recent lows. It consists of:
- Stop-losses from long holders (who stop out when price breaks below the low)
- Sell stop orders from breakout traders (who enter short when price breaks below support)
When institutions need to buy large positions, they target SSL, they push price below the low to trigger all those sell orders, use that selling as the counter-party for their buying, then drive the price back up.
SSL sweep = bullish signal: price spikes below lows, absorbs sell orders, then reverses upward.
BSL vs. SSL at a Glance
|
Buy-Side Liquidity (BSL) |
Sell-Side Liquidity (SSL) |
|
|
Location |
Above recent highs |
Below recent lows |
|
What sits there |
Short stops + breakout buy orders |
Long stops + breakout sell orders |
|
Who targets it |
Institutions entering short |
Institutions entering long |
|
Sweep result |
Bearish reversal |
Bullish reversal |
|
What it looks like |
Wick piercing above a high |
Wick piercing below a low |
What Does a Liquidity Sweep Look Like on a Crypto Chart?
A liquidity sweep has three clear visual components:
- A well-defined level: a swing high, swing low, equal highs, equal lows, or round number that has been tested at least once before. The more obvious the level, the more stop orders cluster there.
- A sharp pierce through the level: price briefly breaks above (BSL sweep) or below (SSL sweep) the level, typically forming a visible wick or small candle body beyond the key level. This move is sudden, it happens in one to three candles.
- A swift reversal: price closes back on the original side of the level, often with a strong rejection candle (engulfing, hammer, pin bar). The reversal is the confirmation that the move was a sweep, not a genuine breakout.

Bullish SSL sweep on BTC/USDT 4H: wick below swing low, reversal above - Source: BingX

Bearish BSL sweep on BTC/USDT 4H: Wick above swing high, reversal below - Source: BingX
How to Identify and Trade a Bullish Liquidity Sweep
A bullish liquidity sweep (sweep of sell-side liquidity) is the setup that precedes a significant move upward. Here is exactly what to look for:
Step 1: Find a Clear Swing Low or Equal Lows
Identify a price level that has acted as support and been tested at least once. Equal lows, where two or more swing lows sit at the same price, are the highest-probability targets because they attract double the stop orders.
Step 2: Watch for a Quick Pierce Below the Level
Price briefly breaks below the swing low or equal lows. The move is sharp and fast, this is the sweep. The candle body may close below the level, or only the wick extends below.
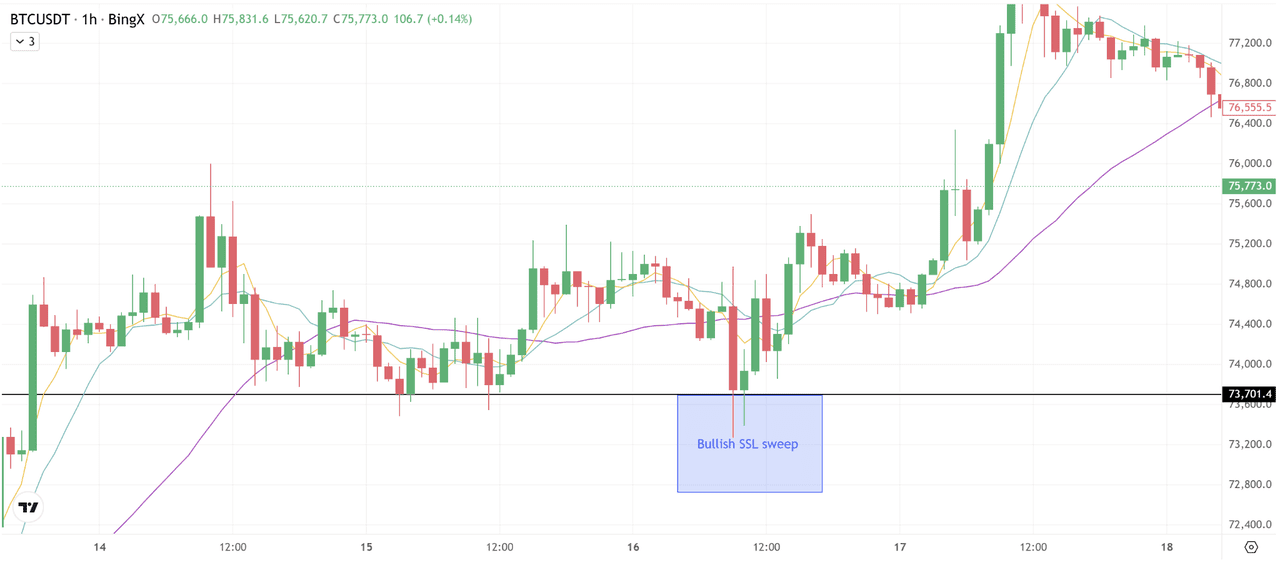
Bullish SSL sweep on BTC/USDT 4H: wick below swing low, reversal above - Source: BingX
On this BTC/USDT 1-hour chart, support formed near $73,701, where price previously reacted. In the chart, Bitcoin briefly dropped below $73,701 into the $72,800 to $73,000 zone before rebounding. This sharp move likely took out stops from traders who bought support.
Step 3: Watch for the Reversal Candle
The critical confirmation: the next candle (or the sweep candle itself) closes back ABOVE the swept level. A strong bullish close back above the low = confirmation the level was swept, not broken.
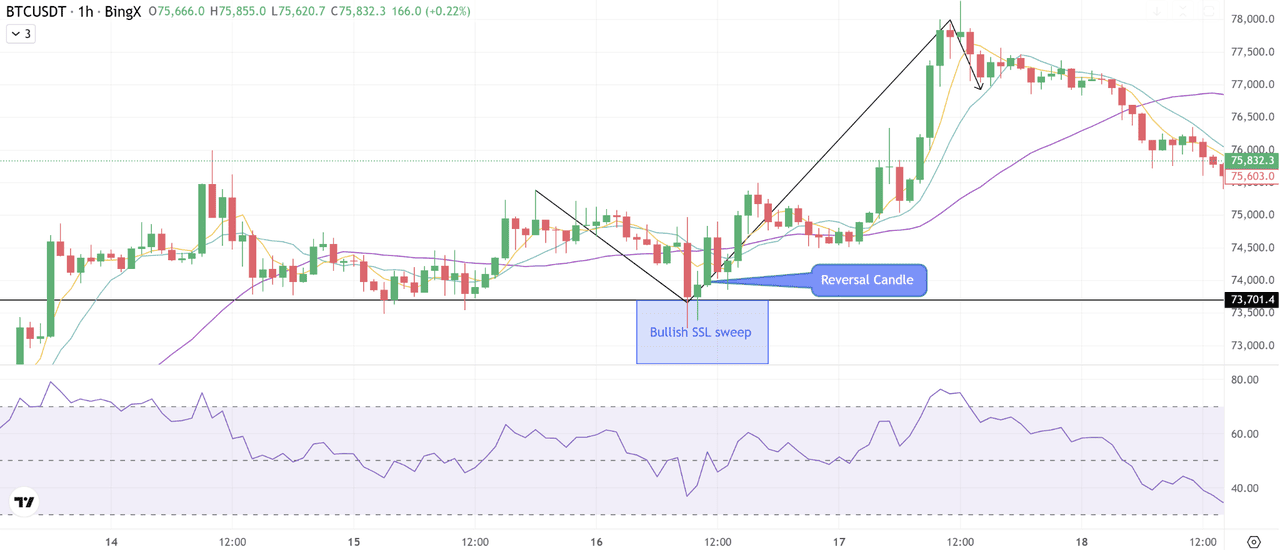
Bullish SSL sweep on BTC/USDT 4H: wick below swing low, reversal above - Source: BingX
The real confirmation comes when price closes back above support. Here, the next strong bullish candle reclaimed $73,701, showing the breakdown failed. That often signals institutions used panic selling as liquidity to buy.
Step 4: Confirm with Market Context
- Is the higher timeframe (Daily or Weekly) in an uptrend or at major support?
- Is RSI showing oversold conditions or bullish divergence?
- Did the sweep happen near an order block or Fair Value Gap?
The more confluence, the higher the probability. Such as in the discussed scenario, a trader sees BTC lose $73,700 support and shorts the breakdown. Minutes later, price recovers above support and rallies $4,000. That is a classic bullish liquidity sweep.
Simple Rule: Break below support + fast reclaim + bullish follow-through = possible bullish liquidity sweep.
See our full guide: What Is an Order Block in Crypto Trading? How to Identify and Trade Them
How to Identify and Trade a Bearish Liquidity Sweep
A bearish liquidity sweep (sweep of buy-side liquidity) precedes a significant move downward. Mirror of the bullish setup:
Step 1: Find a Clear Swing High or Equal Highs
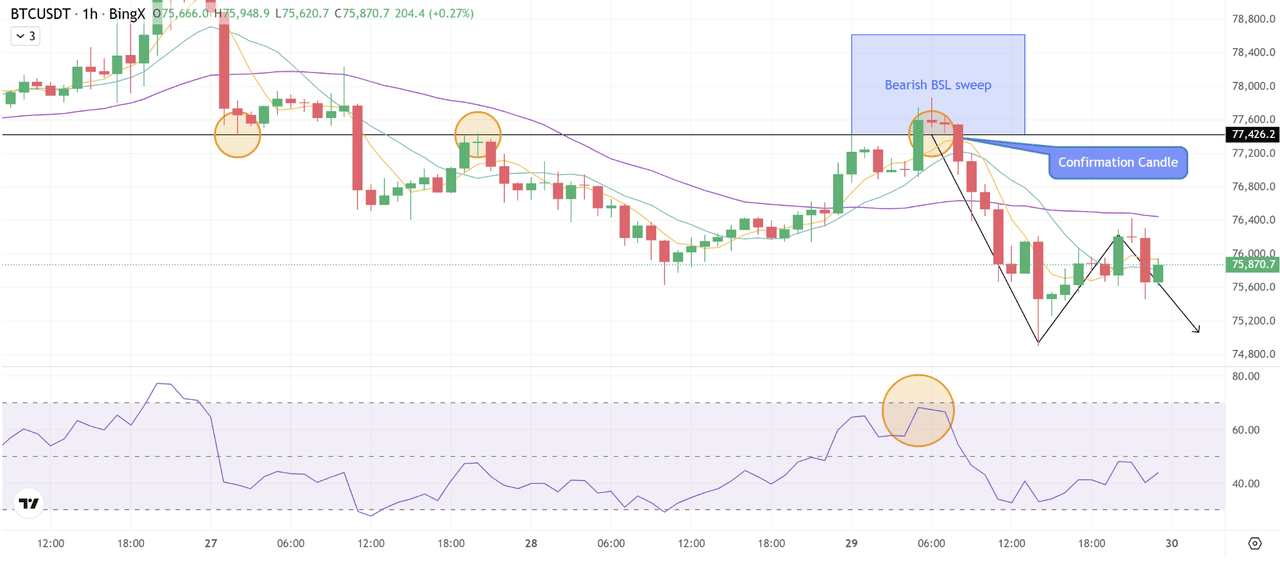
Identify a resistance level that has been tested at least once. Equal highs at the same price level are the strongest targets. On this BTC/USDT 1-hour chart below, resistance formed near $77,424, where price rejected earlier.
Step 2: Watch for a Quick Pierce Above the Level
Price briefly breaks above the swing high or equal highs. The move may last only one to three candles. In the chart, Bitcoin briefly rallied into the $77,500 to $77,800 zone above resistance before failing.
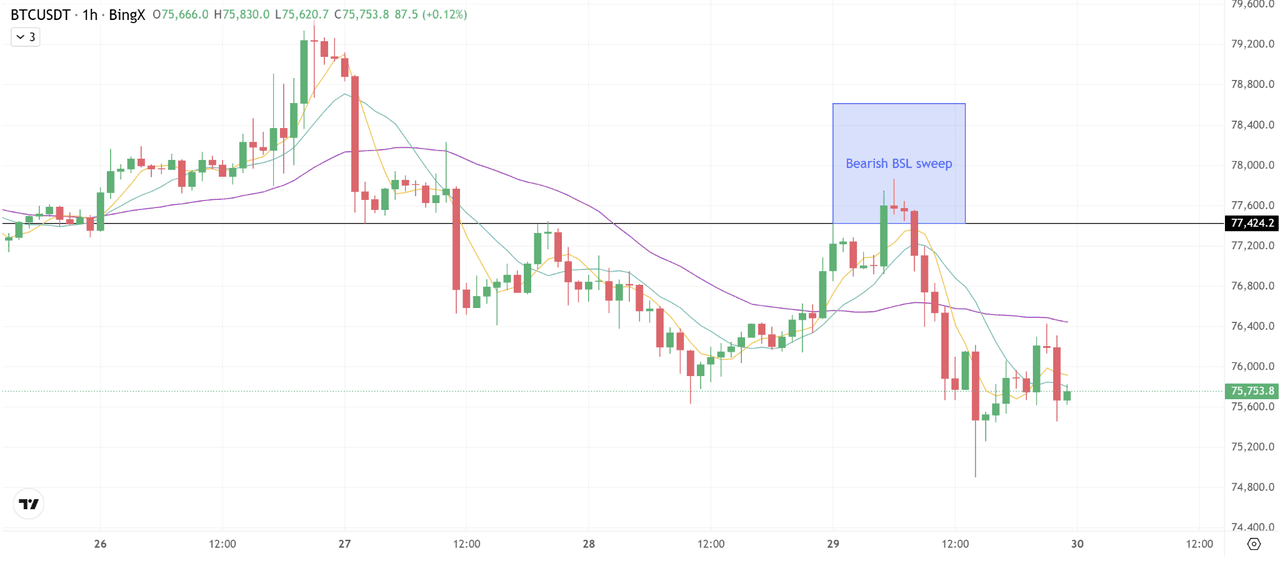
Bearish BSL sweep on BTC/USDT 4H: Wick above swing high, reversal below - Source: BingX
Step 3: Watch for the Reversal Candle
Confirmation: the next candle closes back below the swept level. A strong bearish close back under the high = the level was swept, not broken. Here, the next bearish candle rejected the breakout and dropped back under $77,424, showing buyers were trapped.
Step 4: Confirm with Market Context
- Is the higher timeframe in a downtrend or at major resistance?
- Is RSI showing overbought conditions or bearish divergence?
- Is there an order block or FVG directly below that could provide the push lower?
A trader buys BTC after the break above $77,400 expecting a rally. Instead, price reverses and falls $2,000. That is a classic bearish liquidity sweep.
Simple Rule: Break above resistance + fast rejection + bearish follow-through = possible bearish liquidity sweep.
Liquidity Sweep vs. Liquidity Grab vs. True Breakout
These three terms are closely related but describe distinct market events. Understanding the difference is critical for not misreading the setup:
|
Liquidity Sweep |
Liquidity Grab |
True Breakout |
|
|
Duration |
1–3 candles pierce the level |
Single candle — one wick only |
Multiple candles close beyond level |
|
Candle close |
Closes back inside the range |
Closes back inside (one bar) |
Closes and stays beyond the level |
|
Volume |
Spike on the pierce |
Spike on the wick |
Sustained volume beyond the level |
|
Signal |
Reversal in opposite direction |
Reversal in opposite direction |
Continuation in breakout direction |
|
Wick appearance |
Visible wick + sometimes small body |
Very long single wick (pin bar style) |
No significant wick — body closes beyond |
|
What follows |
Strong move opposite to the sweep |
Strong move opposite to the grab |
Trend continuation beyond the level |
The single most important rule: A liquidity sweep is identified by the candle close, not the wick. If the candle closes back inside the range → sweep. If the candle closes and remains beyond the level → potential true breakout.
How to Trade a Liquidity Sweep on BingX: Step-by-Step
Trading a Bullish Liquidity Sweep: Long Trade
Setup: Price sweeps below a swing low or equal lows and reverses.
Step 1: Mark your SSL level Identify the swing low or equal lows before price reaches them. Draw a horizontal line at the level.
Step 2: Wait for the sweep and reversal confirmation Do not enter when price breaks below the low. Wait for the candle to close back above the level — this is your confirmation signal.
Step 3: Refine entry on a lower timeframe Drop to the 1H or 15M chart. Look for:
- A bullish engulfing candle forming inside a Fair Value Gap (FVG) on the reversal
- A bullish order block from the prior structure
- RSI turning up from oversold territory
Step 4: Set your entry Enter long on the confirmation candle close, or on the first retest of the swept level (now acting as support).
Step 5: Set your stop-loss Place it just below the lowest point of the sweep wick, with a small buffer. If price returns to the exact depth of the sweep, the setup is invalidated.
Step 6: Set your take-profit Target the next BSL zone above — the nearest swing high, equal highs, or key resistance. Aim for a minimum 1:2 risk-to-reward ratio. Consider partial profit at the midpoint.
Trading a Bearish Liquidity Sweep: Short Trade
Setup: Price sweeps above a swing high or equal highs and reverses.
Step 1: Mark your BSL level Identify the swing high or equal highs before price reaches them. Draw a horizontal line.
Step 2: Wait for the sweep and reversal confirmation Do not short when price breaks above the high. Wait for the candle to close back below the BSL level.
Step 3: Refine entry on a lower timeframe Look for:
- A bearish order block forming on the retest
- A bearish Fair Value Gap that price is filling on the way down
- RSI turning down from overbought
Step 4: Set your entry Enter short on the confirmation candle close, or on the first retest of the swept level (now acting as resistance).
Step 5: Set your stop-loss Place it just above the highest point of the sweep wick with a small buffer.
Step 6: Set your take-profit Target the next SSL zone below — nearest swing low, equal lows, or key support. Minimum 1:2 risk-to-reward.
How to Combine Liquidity Sweeps With Other SMC Tools
Liquidity sweeps are most powerful when combined with other Smart Money Concepts (SMC) tools. Here are the three highest-probability combinations:
1. Liquidity Sweep + Fair Value Gap (FVG)
This is one of the most practical Smart Money Concepts setups. After a liquidity sweep, price often reverses sharply and creates a Fair Value Gap (FVG), which is an imbalance left by aggressive candles. When price later retraces into that gap, traders use it as a cleaner entry zone.
How to Spot It on a Chart
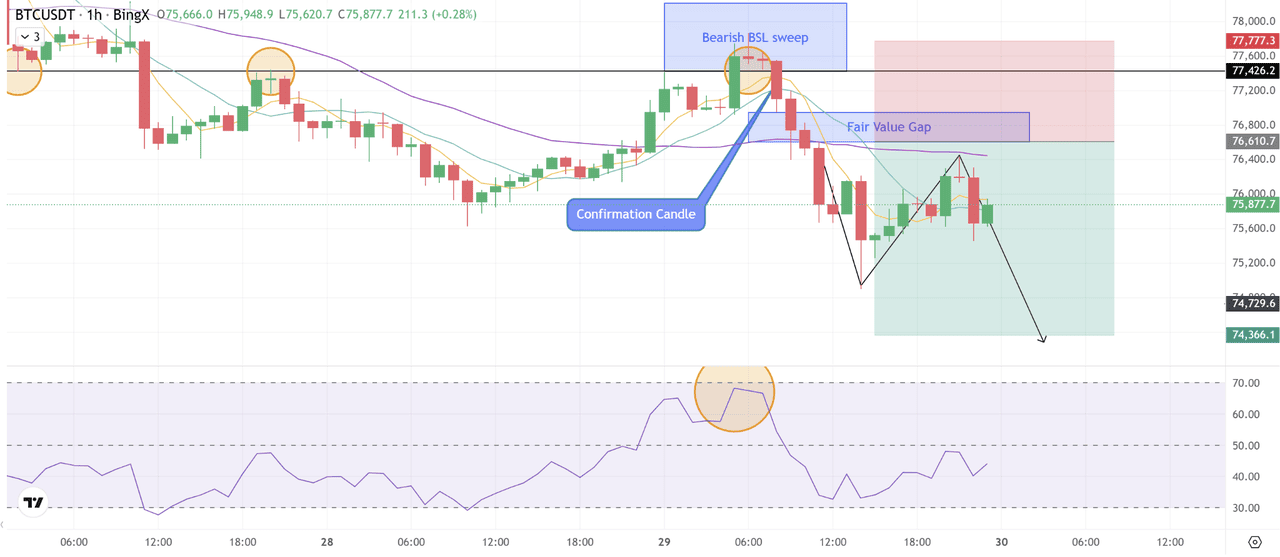
On this BTC/USDT 1-hour chart:
- Price first performed a Bearish Buy-Side Liquidity Sweep above $77,426
- BTC briefly moved into the $77,500–$77,700 zone, trapping breakout buyers
- Price then sharply reversed lower
- During that drop, a bearish Fair Value Gap formed around $76,700 to $76,950 (purple zone)
- Price later retraced into that zone and rejected again
That retest gave traders a second short-entry opportunity with lower risk.
How to Use It
- Wait for the liquidity sweep above resistance
- Confirm reversal with strong bearish candles
- Mark the FVG created during the selloff
- Wait for price to revisit the FVG
- Enter short on rejection
SSL swept, reversal creates FVG, entry on FVG retest on BTC/USDT - Source: BingX
Bitcoin sweeps above $77,426, then drops sharply. Later price rebounds into $76,800 (inside the FVG), stalls, then turns lower again toward $74,700.
That means:
- Entry: around $76,800
- Stop-loss: above $77,000 or sweep high
- Target: $75,200 then $74,700
Why Traders Like It: Instead of chasing the first drop, traders wait for price to come back into the imbalance zone for a smarter entry.
Simple Rule: Sweep liquidity → sharp reversal → mark FVG → trade the retest.
2. Liquidity Sweep + Order Block
Order blocks (the last candle before an impulsive move) often sit directly at or near liquidity sweep levels. When price sweeps a level and then retests an order block on the reversal, the two signals confirm each other.
How to Use Liquidity Sweep with Order Book
- Mark the order block from the prior structure
- Wait for price to sweep liquidity near the OB zone
- Enter on the OB retest after the sweep confirmation
- Stop-loss: beyond the OB zone
- This combination is covered in detail in our Order Block guide.
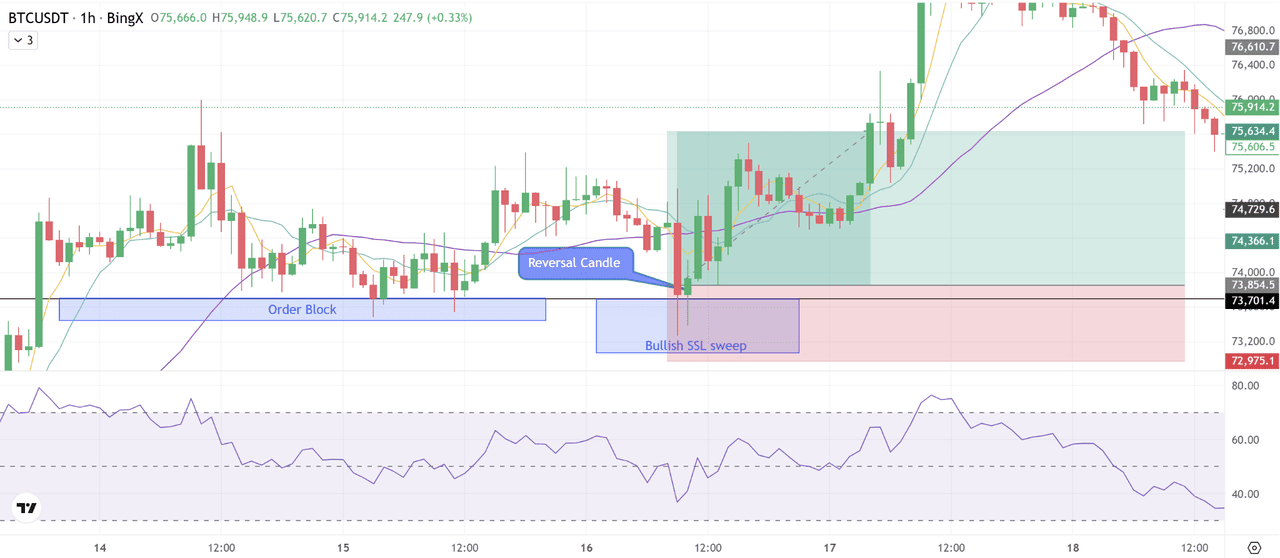
Here, BTC/USDT first dropped below support and performed a Bullish Sell-Side Liquidity Sweep (SSL) under $73,701, triggering stop-losses below the lows. Price then quickly reclaimed the level with a strong reversal candle.
At the same time, the sweep happened inside a previously marked bullish order block (blue zone), where buyers had stepped in before. That means two bullish signals aligned:
- Liquidity collected below support
- Price reacted from a demand/order block zone
This combination often gives stronger reversal probability than using one signal alone.
Liquidity Sweep + Order Block on BTC/USDT - Source: BingX
Bitcoin traded near $73,700 support.
- Price briefly dipped into $73,200–$73,500
- Stops below lows were triggered
- BTC then reclaimed $73,701 and rallied sharply toward $75,600+
Possible setup:
- Entry: $73,800–$74,000 after reclaim
- Stop-loss: below $73,200
- Targets: $74,700, then $75,600
Why It Works: Institutions may use the stop-loss liquidity below lows to fill buy positions inside the order block.
Simple Rule: Sweep the lows + hold order block + strong reclaim = bullish setup.
3. Liquidity Sweep + Higher Timeframe Structure
A sweep carries far more weight when it aligns with the higher timeframe directional bias:
- Daily uptrend + 4H SSL sweep = highest probability bullish setup
- Daily downtrend + 4H BSL sweep = highest probability bearish setup
- A sweep against the daily trend has a much lower success rate and should be avoided or traded with reduced position size
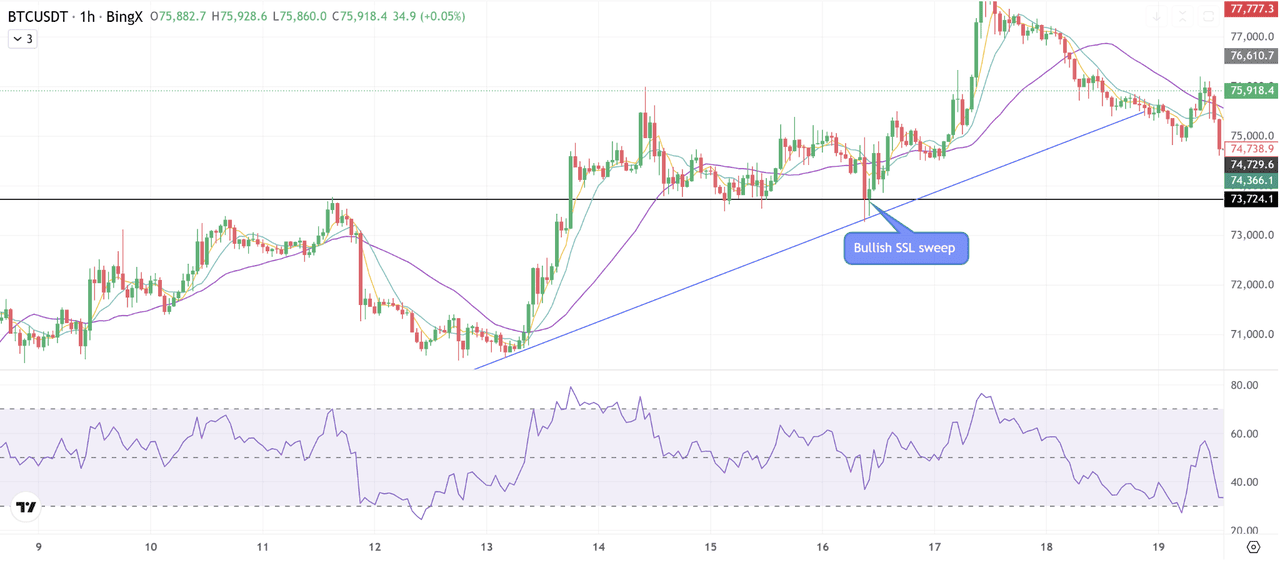
Liquidity Sweep + Higher Timeframe Structure - Source: BingX
Confluence Checklist: Before Every Sweep Trade
- Higher timeframe trend identified (Daily or Weekly)
- SSL or BSL level clearly marked in advance
- Price swept the level — wick pierced beyond it
- Candle closed back inside the range (reversal confirmed)
- RSI confirms: oversold for bullish sweep, overbought for bearish sweep
- Fair Value Gap or Order Block aligns with the entry zone
- Stop-loss placed beyond the sweep wick extreme
- Take-profit at the next opposing liquidity zone (BSL for longs, SSL for shorts)
- Risk-to-reward is at least 1:2
- Position size is within 1–2% account risk
What Are the Common Mistakes When Trading Liquidity Sweeps?
Before diving into strategies, it’s important to understand the common pitfalls traders face when handling liquidity sweeps.
1. Entering on the Break, Not on the Confirmation
The most common and most expensive error. The break below the low (or above the high) is the sweep, it is NOT the entry signal. The entry signal is the candle closing back inside the range. Entering on the break means you're entering as the stop hunt is in progress, before you know if it's a sweep or a true breakout.
2. Not Waiting for the Candle to Close
Traders watch a wick pierce below a low and immediately enter long, before the candle has closed. The wick could extend further. The candle could close below the level (true breakout). Always wait for the candle to fully close and confirm the close is back inside the range.
3. Trading Sweeps in Isolation
A sweep wick alone has roughly a 50/50 chance of being followed by a reversal. Combined with a higher timeframe trend, an FVG, and an order block, the probability improves significantly. Never trade a sweep without at least one additional confluence.
4. Misidentifying True Breakouts as Sweeps
If price breaks a level and continues closing beyond it candle after candle, that is a true breakout, not a sweep. The sweep reversal happens quickly (within 1–3 candles). If price is still below the low after 4+ candles, you are likely looking at a genuine breakdown. Do not try to "call the sweep" on a trending move.
5. Placing the Stop-Loss Too Tight
Crypto volatility means sweep wicks can be aggressive, Bitcoin can sweep 2–3% below a level before reversing. Placing your stop-loss right at the level instead of below the wick extreme will result in getting stopped out of a perfectly valid setup. Always give the wick room.
6. Ignoring Market Sessions
Liquidity sweeps happen most frequently at the start of major trading sessions, particularly the London open (8:00 AM GMT) and New York open (1:00 PM GMT), when institutional volume enters the market and creates the aggressive moves needed for a sweep. Sweeps during low-volume Asian session hours are less reliable. Although crypto market trades 24/7, so there is no official market open like forex or stocks. However, liquidity and volume are not equal all day. Crypto still reacts strongly when major global trading regions become active.
How to Use Liquidity Sweeps on BingX
On BingX Spot
Use the built-in TradingView chart to mark BSL and SSL levels. When a bullish sweep occurs below a swing low, use a limit buy order slightly above the swept level to enter on the close back above.
On BingX Perpetual Futures
Liquidity sweeps are particularly powerful in perpetuals because you can trade both directions, long on SSL sweeps and short on BSL sweeps. Use BingX's Take Profit/Stop Loss feature when placing orders to automate your exit levels.
BingX Charting Setup for Sweep Trading
- Open BTC/USDT on BingX and switch to the advanced TradingView chart view
- Select the 4H timeframe as your primary identification timeframe
- Use the Horizontal Line tool to mark swing highs (BSL) and swing lows (SSL)
- Use the Rectangle tool to highlight equal highs and equal lows zones
- Add the RSI indicator (14 period) in the lower panel for confirmation
- Drop to 1H or 15M for entry confirmation once a sweep is spotted on the 4H
Conclusion: Should You Trade Crypto with Liquidity Sweeps?
Liquidity sweeps are one of the most misunderstood and most tradeable events in crypto markets. What feels like the market "hunting your stop-loss" is actually a calculated institutional move to fill large orders using retail stop clusters as liquidity. Once you understand where liquidity accumulates (swing highs, swing lows, equal highs, equal lows), and what a sweep looks like (a pierce beyond the level followed by a close back inside the range), you can stop being the fuel for institutional moves and start positioning alongside them.
The key rules: mark your BSL and SSL levels in advance, never enter on the break itself, only enter on the confirmed close back inside the range, place your stop beyond the wick extreme, and always align the trade with the higher timeframe trend. Combined with Fair Value Gaps and Order Blocks, liquidity sweeps become one of the highest-probability setups available in crypto trading.
Practice identifying sweeps on BingX's BTC/USDT 4H chart using historical data before trading them live. Mark the levels, observe how price behaves around them, and build your eye for the setup.
Related Articles
- What Is an Order Block in Crypto Trading? How to Identify and Trade Them
- War & Crypto: How to Profit from Liquidity Gaps & Fair Value Gaps (FVG) During Global Uncertainty
- Crypto Chart Patterns: The Complete Guide for Traders
- Crypto Candlestick Patterns: A Complete Guide for Traders
- Inverted Hammer Candlestick Pattern: What It Is & How to Trade It
- How to Use RSI in Crypto Trading
- Risk Management in Crypto Trading
- How to Keep a Trading Journal
FAQs on Liquidity Sweeps in Crypto Trading
1. What is a liquidity sweep in crypto trading and how does it work?
A liquidity sweep is a sudden price move beyond a key high or low, such as a swing high, equal highs, or a round number, that triggers stop-loss orders and pending orders clustered at that level, before sharply reversing in the opposite direction. It is a calculated move by large institutions to fill their orders using retail stop-losses as liquidity, without causing excessive slippage on their own positions.
2. What is the difference between a liquidity sweep and a stop hunt?
The terms are often used interchangeably. A stop hunt describes the intent (institutions hunting for retail stop-loss orders), while a liquidity sweep describes the mechanical action on the chart (price briefly piercing a level to absorb orders). Both refer to the same market event, the key difference is framing. In SMC and ICT trading, "liquidity sweep" is the more precise term.
3. What is the difference between a liquidity sweep and a liquidity grab?
A liquidity grab is a single-candle event, one bar forms a very long wick through a level and immediately closes back inside the range, producing a pin bar or spike candle. A liquidity sweep can involve 1–3 candles briefly moving beyond a level before returning. Both signal a potential reversal, but a grab is faster and more visually obvious, while a sweep can be subtler and take slightly longer to resolve.
4. How do you identify a liquidity sweep?
Look for: (1) a well-defined swing high, swing low, equal highs, or equal lows that have been tested at least once; (2) a sudden price move that briefly breaks beyond that level forming a visible wick; (3) the candle closing back inside the range, this is the confirmation. The candle close is the critical signal. If price stays beyond the level, it is a true breakout, not a sweep.
5. What is buy-side liquidity and sell-side liquidity?
Buy-side liquidity (BSL) sits above recent highs, it consists of short sellers' stop-losses and breakout buy orders. When institutions sweep BSL, they trigger these buy orders to use as liquidity for their selling. Sell-side liquidity (SSL) sits below recent lows, it consists of long holders' stop-losses and breakout sell orders. When institutions sweep SSL, they trigger these sell orders to use as liquidity for their buying. A BSL sweep typically precedes a bearish move; an SSL sweep typically precedes a bullish move.
6. What is the best timeframe for trading liquidity sweeps?
The 4-hour and Daily timeframes produce the most reliable liquidity sweep setups in crypto. Most SMC traders identify the sweep level on the 4H chart and then drop to the 1H or 15M for a precise entry confirmation. Sweeps on lower timeframes (5M, 15M) occur frequently but are less reliable and more prone to false signals.
7. How is a liquidity sweep different from a true breakout?
A liquidity sweep closes back inside the range within 1–3 candles, the wick pierces the level but the candle body closes back inside. A true breakout closes beyond the level and continues, multiple candles close outside the range on sustained volume. If you are unsure, wait for the candle to close before making any decision.
8. Can you trade liquidity sweeps in both directions on BingX?
Yes. BingX Perpetual Futures allows you to go long (buy) on bullish SSL sweeps or go short (sell) on bearish BSL sweeps. You can use BingX's built-in Take Profit and Stop Loss parameters when placing orders to automate your exit levels at the moment you enter the trade.
9. What are equal highs and equal lows in liquidity sweep trading?
Equal highs are two or more swing highs sitting at approximately the same price level. Equal lows are two or more swing lows at the same price. These are the highest-probability liquidity sweep targets in SMC trading because the double (or triple) test at the same level creates a concentration of stop-loss orders far larger than a single swing high or low. When equal highs or lows are swept, the reversal is often more aggressive.
10. What is the connection between liquidity sweeps and order blocks?
Order blocks (the last candle before a strong impulsive move) frequently sit near liquidity sweep levels. A common high-probability setup: price sweeps a swing low (SSL), creates a bullish order block on the reversal, and then retests that order block before continuing higher. The sweep confirms institutional interest; the order block provides the precise entry.